The hardware and bandwidth for this mirror is donated by METANET, the Webhosting and Full Service-Cloud Provider.
If you wish to report a bug, or if you are interested in having us mirror your free-software or open-source project, please feel free to contact us at mirror[@]metanet.ch.
seasonal is an easy-to-use and full-featured R-interface to X-13ARIMA-SEATS, the newest seasonal adjustment software developed by the United States Census Bureau.

seasonal depends on the x13binary package to access pre-built binaries of X-13ARIMA-SEATS on all platforms and does not require any manual installation. To install both packages:
install.packages("seasonal")seas is the core function of the seasonal
package. By default, seas calls the automatic procedures of
X-13ARIMA-SEATS to perform a seasonal adjustment that works well in most
circumstances:
m <- seas(AirPassengers)For a more detailed introduction, check our article in the Journal of Statistical Software or consider the vignette:
vignette("seas")In seasonal, it is possible to use almost the complete
syntax of X-13ARIMA-SEATS. The X-13ARIMA-SEATS syntax uses
specs and arguments, with each spec optionally
containing some arguments. These spec-argument combinations can be added
to seas by separating the spec and the argument by a dot
(.). For example, in order to set the ‘variables’ argument
of the ‘regression’ spec equal to td and
ao1999.jan, the input to seas looks like
this:
m <- seas(AirPassengers, regression.variables = c("td", "ao1955.jan"))The best way to learn about the relationship between the syntax of X-13ARIMA-SEATS and seasonal is to study the comprehensive list of examples. Detailed information on the options can be found in the Census Bureaus’ official manual.
seasonal has a flexible mechanism to read data from
X-13ARIMA-SEATS. With the series function, it is possible
to import almost all output that can be generated by X-13ARIMA-SEATS.
For example, the following command returns the forecasts of the ARIMA
model as a "ts" time series:
m <- seas(AirPassengers)
series(m, "forecast.forecasts")There are several graphical tools to analyze a seas
model. The main plot function draws the seasonally adjusted and
unadjusted series, as well as the outliers:
m <- seas(AirPassengers, regression.aictest = c("td", "easter"))
plot(m)The view function is a graphical tool for choosing a
seasonal adjustment model, using the seasonalview
package, with the same structure as the demo website of seasonal.
To install seasonalview,
type:
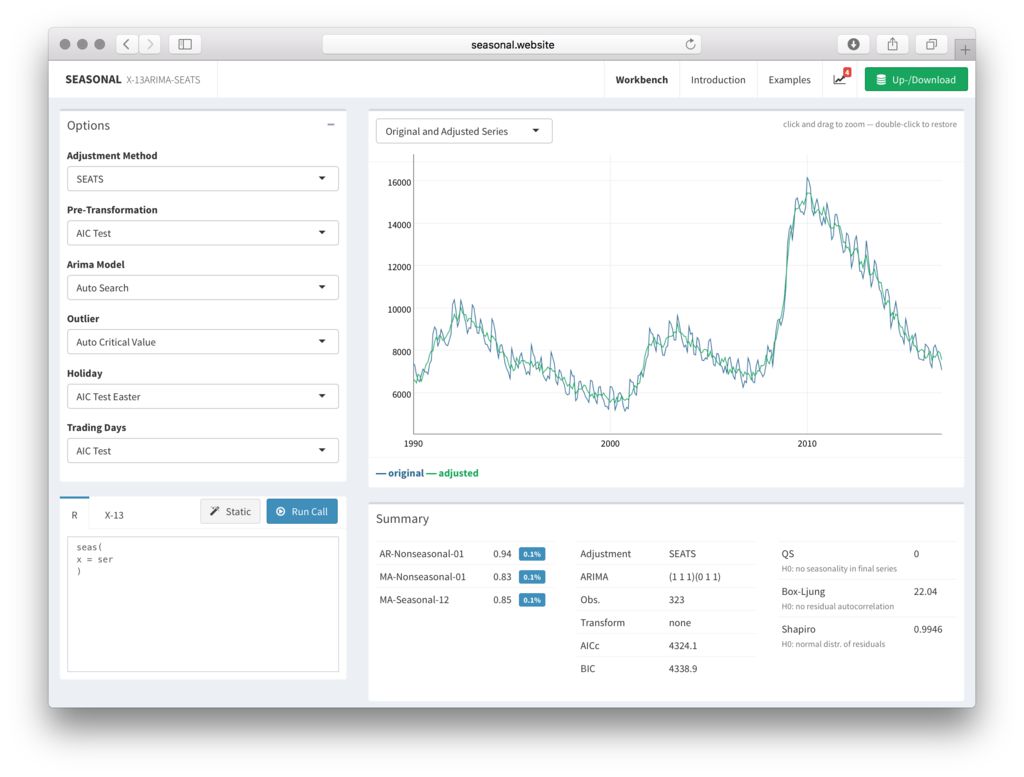
install.packages("seasonalview")The goal of view is to summarize all relevant options,
plots and statistics that should be usually considered.
view uses a "seas" object as its main
argument:
view(m)seasonal is free and open source, licensed under GPL-3. It requires the X-13ARIMA-SEATS software by the U.S. Census Bureau, which is open source and freely available under the terms of its own license.
To cite seasonal in publications use:
Sax C, Eddelbuettel D (2018). “Seasonal Adjustment by X-13ARIMA-SEATS in R.” Journal of Statistical Software, 87(11), 1-17. doi: 10.18637/jss.v087.i11 (URL: https://doi.org/10.18637/jss.v087.i11).
Please report bugs and suggestions on GitHub. Thank you!
These binaries (installable software) and packages are in development.
They may not be fully stable and should be used with caution. We make no claims about them.