The hardware and bandwidth for this mirror is donated by METANET, the Webhosting and Full Service-Cloud Provider.
If you wish to report a bug, or if you are interested in having us mirror your free-software or open-source project, please feel free to contact us at mirror[@]metanet.ch.
shinyjqui package is an R wrapper of jQuery UI javascript library. It can be used to easily add interactions and animation effects to a shiny app.
You can install the stable version from CRAN, or the development version from github with:
# install from CRAN
install.packages('shinyjqui')

# for the development version
devtools::install_github("yang-tang/shinyjqui")# load packages
library(shiny)
library(shinyjqui)
library(ggplot2)
library(highcharter)server <- function(input, output) {}
ui <- fluidPage(
jqui_draggable(fileInput('file', 'File'))
)
shinyApp(ui, server)
server <- function(input, output) {
  output$gg <- renderPlot({
    ggplot(mtcars, aes(x = cyl, y = mpg)) + geom_point()
  })
}

ui <- fluidPage(
  jqui_resizable(plotOutput('gg', width = '200px', height = '200px'))
)

shinyApp(ui, server)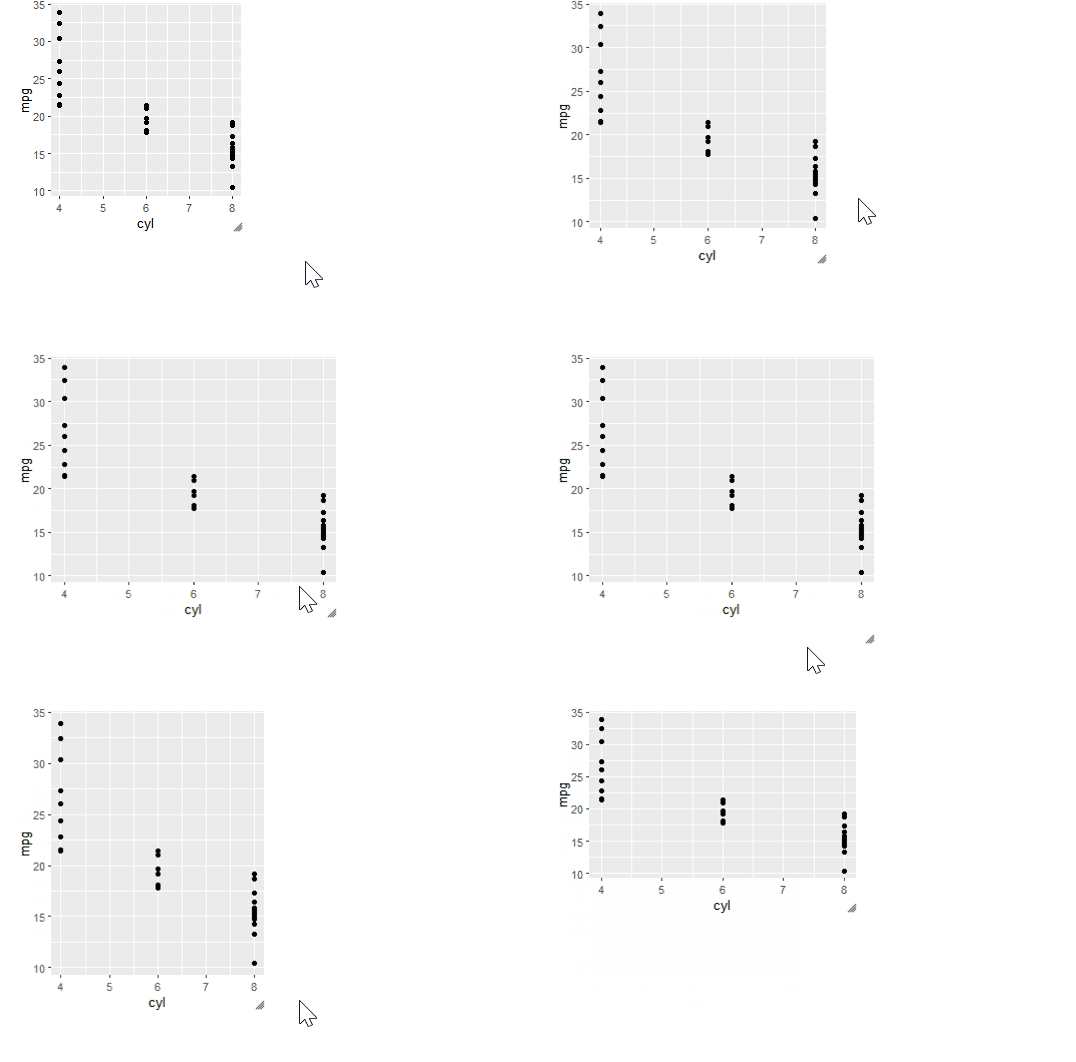
server <- function(input, output) {
  output$hc <- renderHighchart({
    hchart(mtcars, "scatter", hcaes(x = cyl, y = mpg, group = factor(vs))) %>%
      hc_legend(enabled = FALSE)
  })
  output$gg <- renderPlot({
    ggplot(mtcars, aes(x = cyl, y = mpg, color = factor(vs))) +
      geom_point() +
      theme(legend.position= "none")
  })
}

ui <- fluidPage(
  jqui_sortable(div(id = 'plots',
                     highchartOutput('hc', width = '200px', height = '200px'),
                     plotOutput('gg', width = '200px', height = '200px')))
)

shinyApp(ui, server)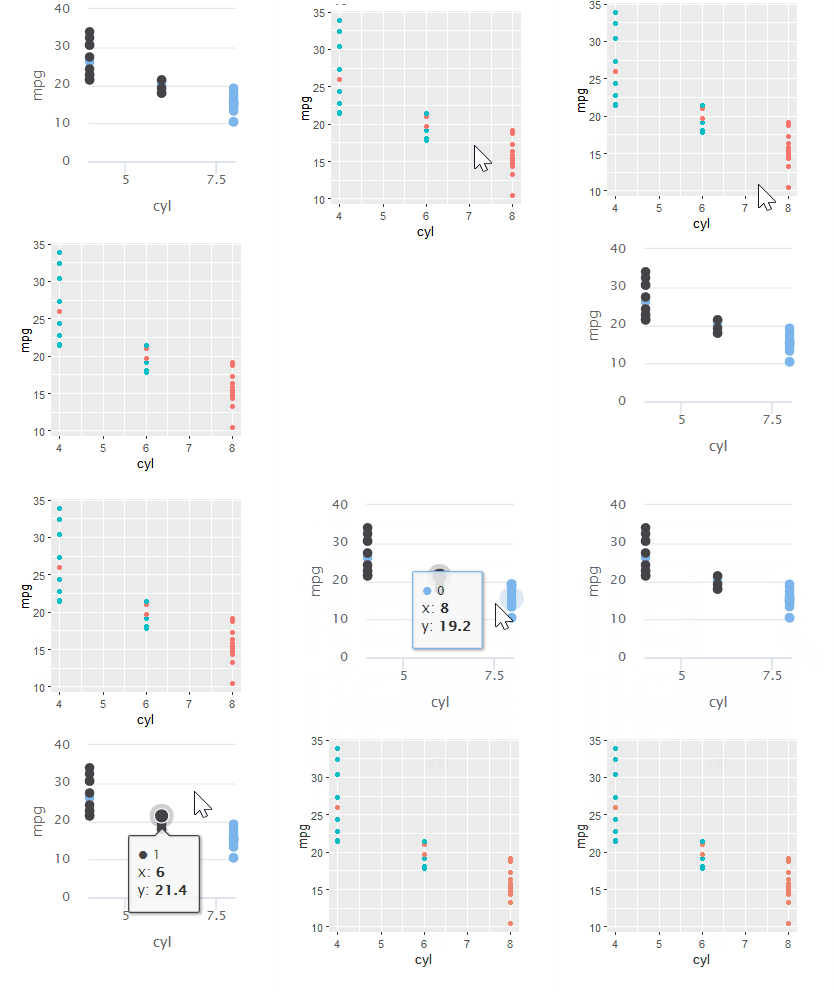
server <- function(input, output) {
  observeEvent(input$show, {
    jqui_show('#gg', effect = input$effect)
  })

  observeEvent(input$hide, {
    jqui_hide('#gg', effect = input$effect)
  })

  output$gg <- renderPlot({
    ggplot(mtcars, aes(x = cyl, y = mpg, color = factor(gear))) +
      geom_point() +
      theme(plot.background = element_rect(fill = "transparent",colour = NA))
  }, bg = "transparent")
}

ui <- fluidPage(
  div(style = 'width: 400px; height: 400px',
      plotOutput('gg', width = '100%', height = '100%')),
  selectInput('effect', NULL, choices = get_jqui_effects()),
  actionButton('show', 'Show'),
  actionButton('hide', 'Hide')
)

shinyApp(ui, server)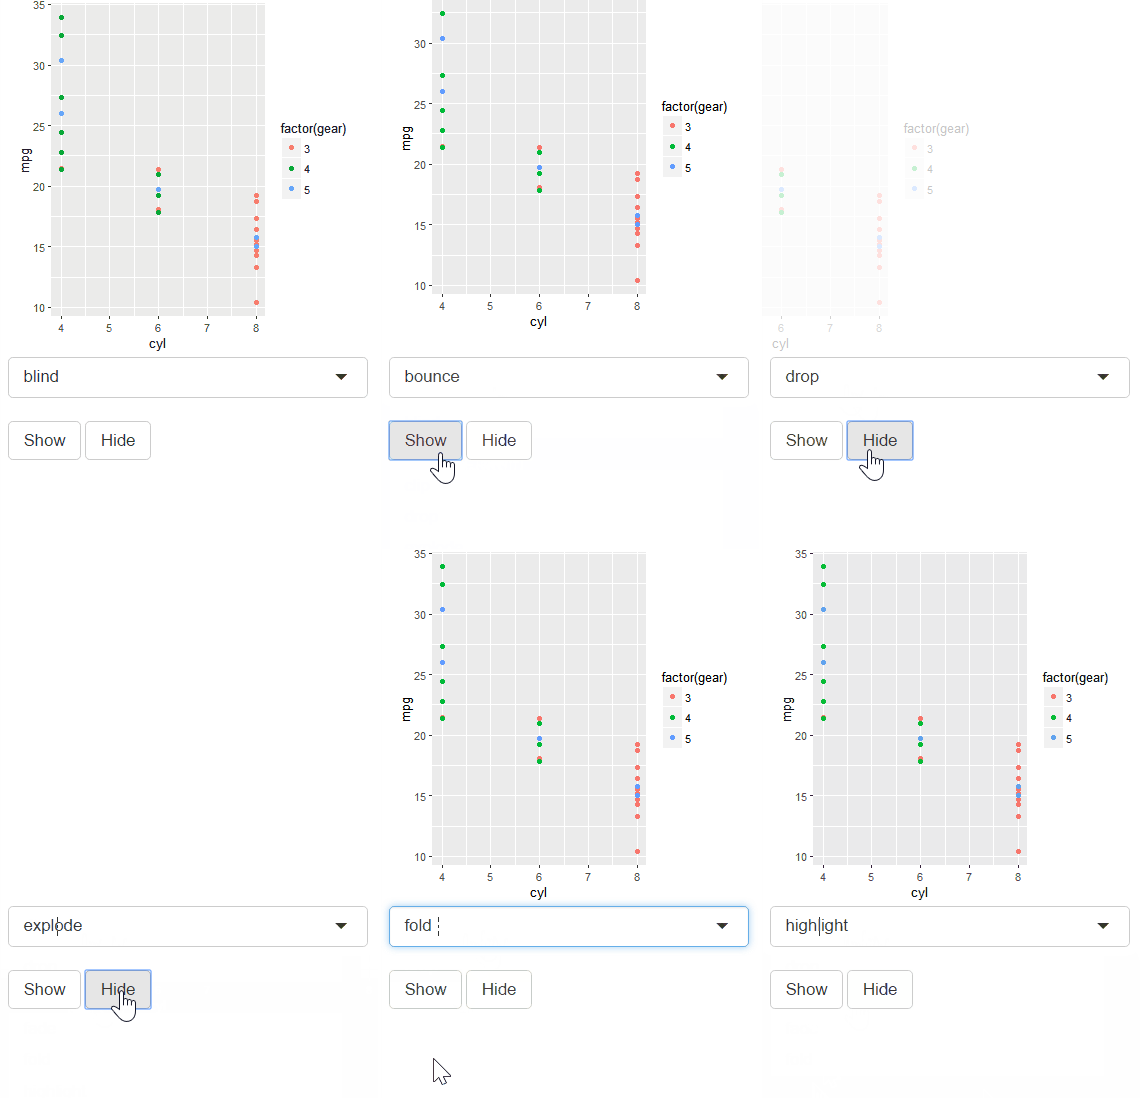
server <- function(input, output) {

  current_class <- c()

  observe({
    input$class
    class_to_remove <- setdiff(current_class, input$class)
    class_to_add <- setdiff(input$class, current_class)
    current_class <<- input$class
    if(length(class_to_remove) > 0) {
      jqui_remove_class('#foo', paste(class_to_remove, collapse = ' '), duration = 1000)}
    if(length(class_to_add) > 0) {
      jqui_add_class('#foo', paste(class_to_add, collapse = ' '), duration = 1000)}
  })

}

ui <- fluidPage(

  tags$head(
    tags$style(
      HTML('.class1 { width: 410px; height: 100px; }
            .class2 { text-indent: 40px; letter-spacing: .2em; }
            .class3 { padding: 30px; margin: 10px; }
            .class4 { font-size: 1.1em; }')
    )
  ),

  div(id = 'foo', 'Etiam libero neque, luctus a, eleifend nec, semper at, lorem. Sed pede.'),
  hr(),
  checkboxGroupInput('class', 'Class',
                     choices = list(`width: 410px; height: 100px;` = 'class1',
                                    `text-indent: 40px; letter-spacing: .2em;` = 'class2',
                                    `padding: 30px; margin: 10px;` = 'class3',
                                    `font-size: 1.1em;` = 'class4'))


)

shinyApp(ui, server)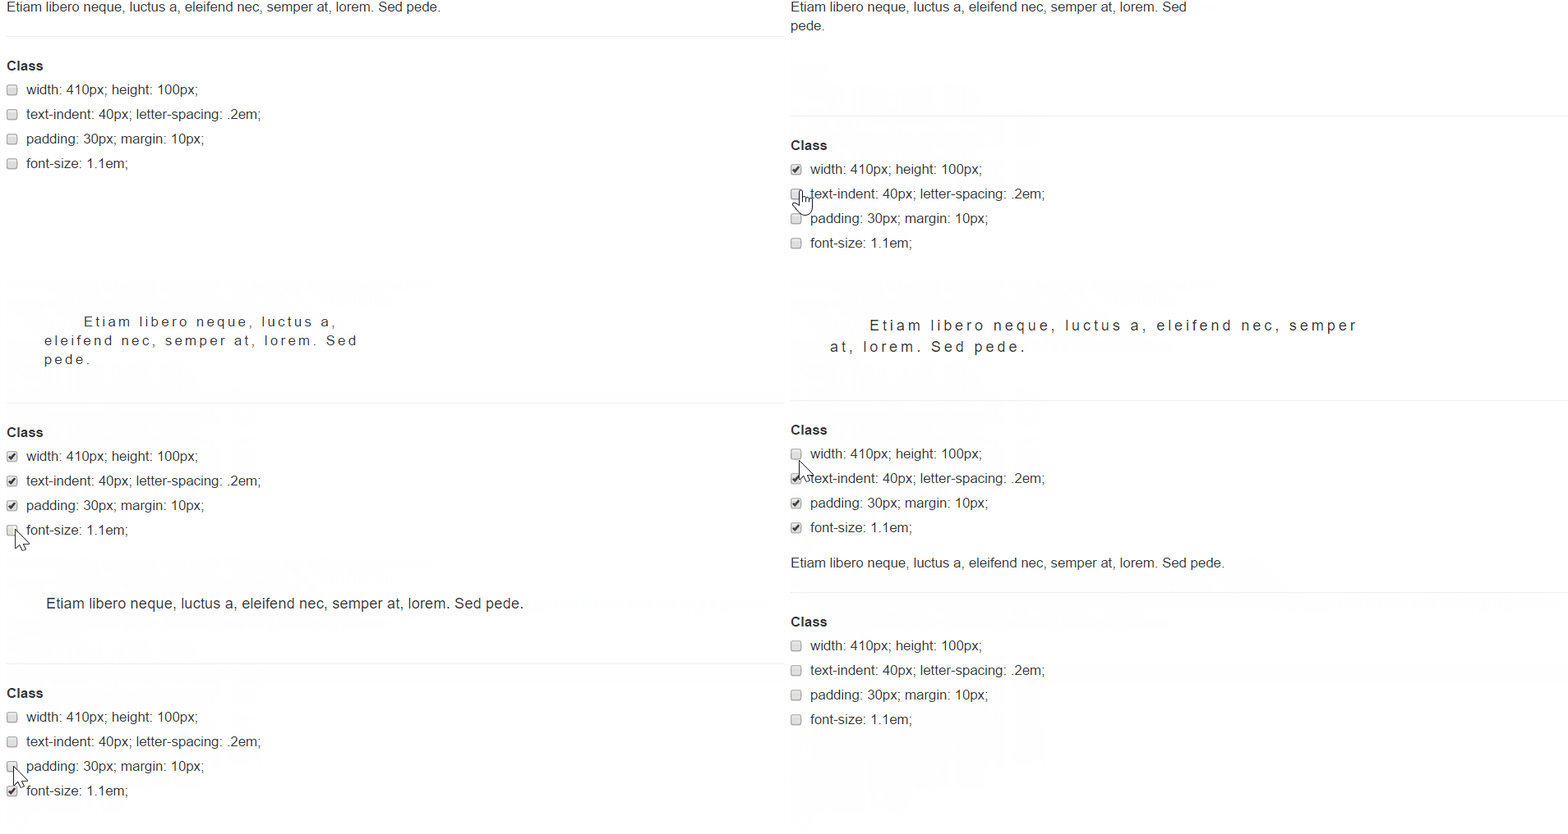
server <- function(input, output) {
  output$order <- renderPrint({ print(input$dest) })
}

ui <- fluidPage(
  orderInput('source', 'Source', items = month.abb,
             as_source = TRUE, connect = 'dest'),
  orderInput('dest', 'Dest', items = NULL, placeholder = 'Drag items here...'),
  verbatimTextOutput('order')
)

shinyApp(ui, server)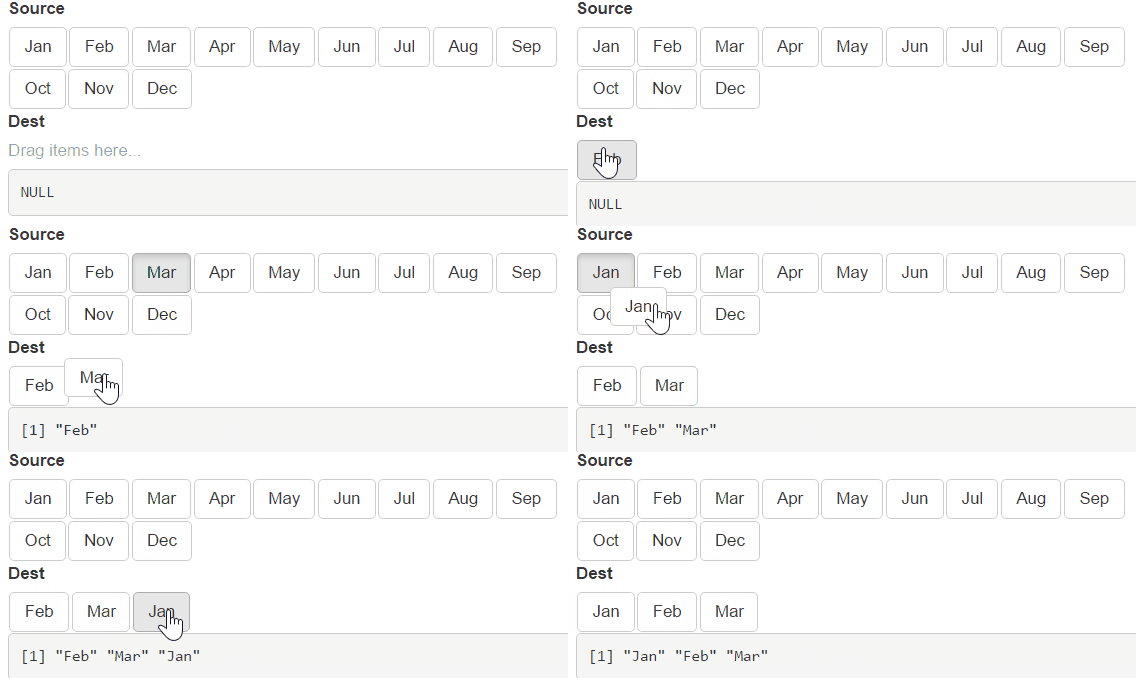
ui <- fluidPage(
  verbatimTextOutput("index"),
  sortableTableOutput("tbl")
)

server <- function(input, output) {
  output$index <- renderPrint({
    cat("Row index:\n")
    input$tbl_row_index
  })
  output$tbl <- renderTable(head(mtcars), rownames = TRUE)
}

shinyApp(ui, server)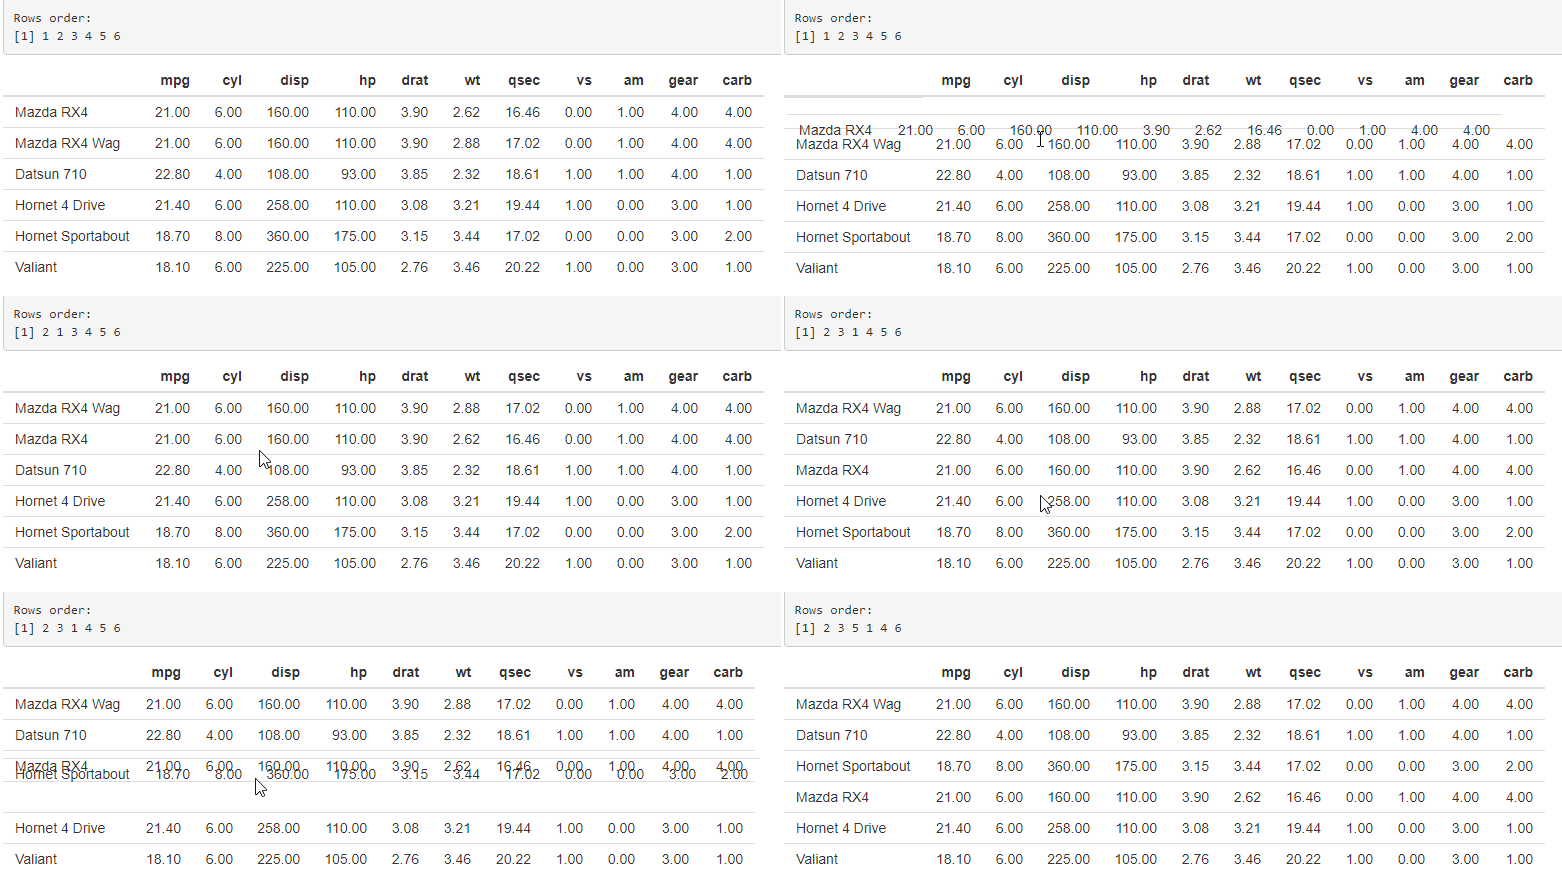
ui <- fluidPage(
  selectableTableOutput("tbl", selection_mode = "cell"),
  verbatimTextOutput("selected")
)

server <- function(input, output) {
  output$selected <- renderPrint({
    cat("Selected:\n")
    input$tbl_selected
  })
  output$tbl <- renderTable(head(mtcars), rownames = TRUE)
}

shinyApp(ui, server)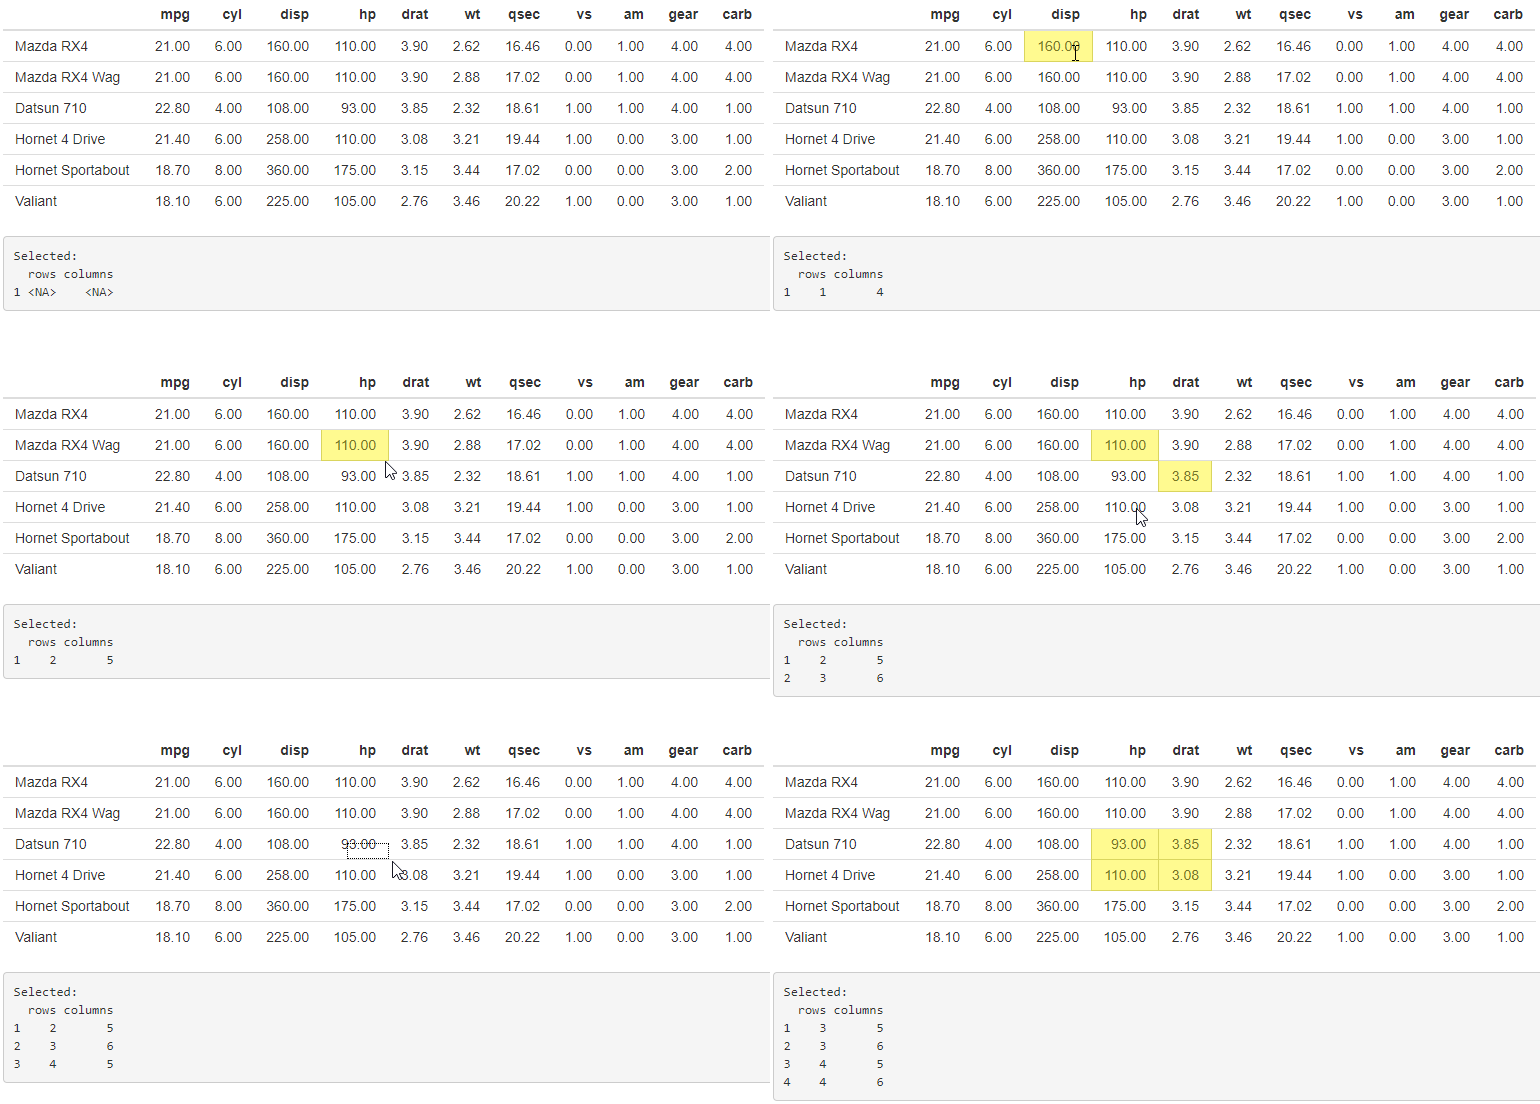
For more information, please visit the package website.
These binaries (installable software) and packages are in development.
They may not be fully stable and should be used with caution. We make no claims about them.