The hardware and bandwidth for this mirror is donated by METANET, the Webhosting and Full Service-Cloud Provider.
If you wish to report a bug, or if you are interested in having us mirror your free-software or open-source project, please feel free to contact us at mirror[@]metanet.ch.

{shinysurveys} provides easy-to-use, minimalistic code for creating and deploying surveys in Shiny. Originally inspired by Dean Attali’s shinyforms, our package provides a framework for robust surveys, similar to Google Forms, in R with Shiny.
You can install {shinysurveys} via CRAN or GitHub and load it as follows:
# Install released version from CRAN
install.packages("shinysurveys")

# Or, install the development version from GitHub
remotes::install_github("jdtrat/shinysurveys")

# Load package
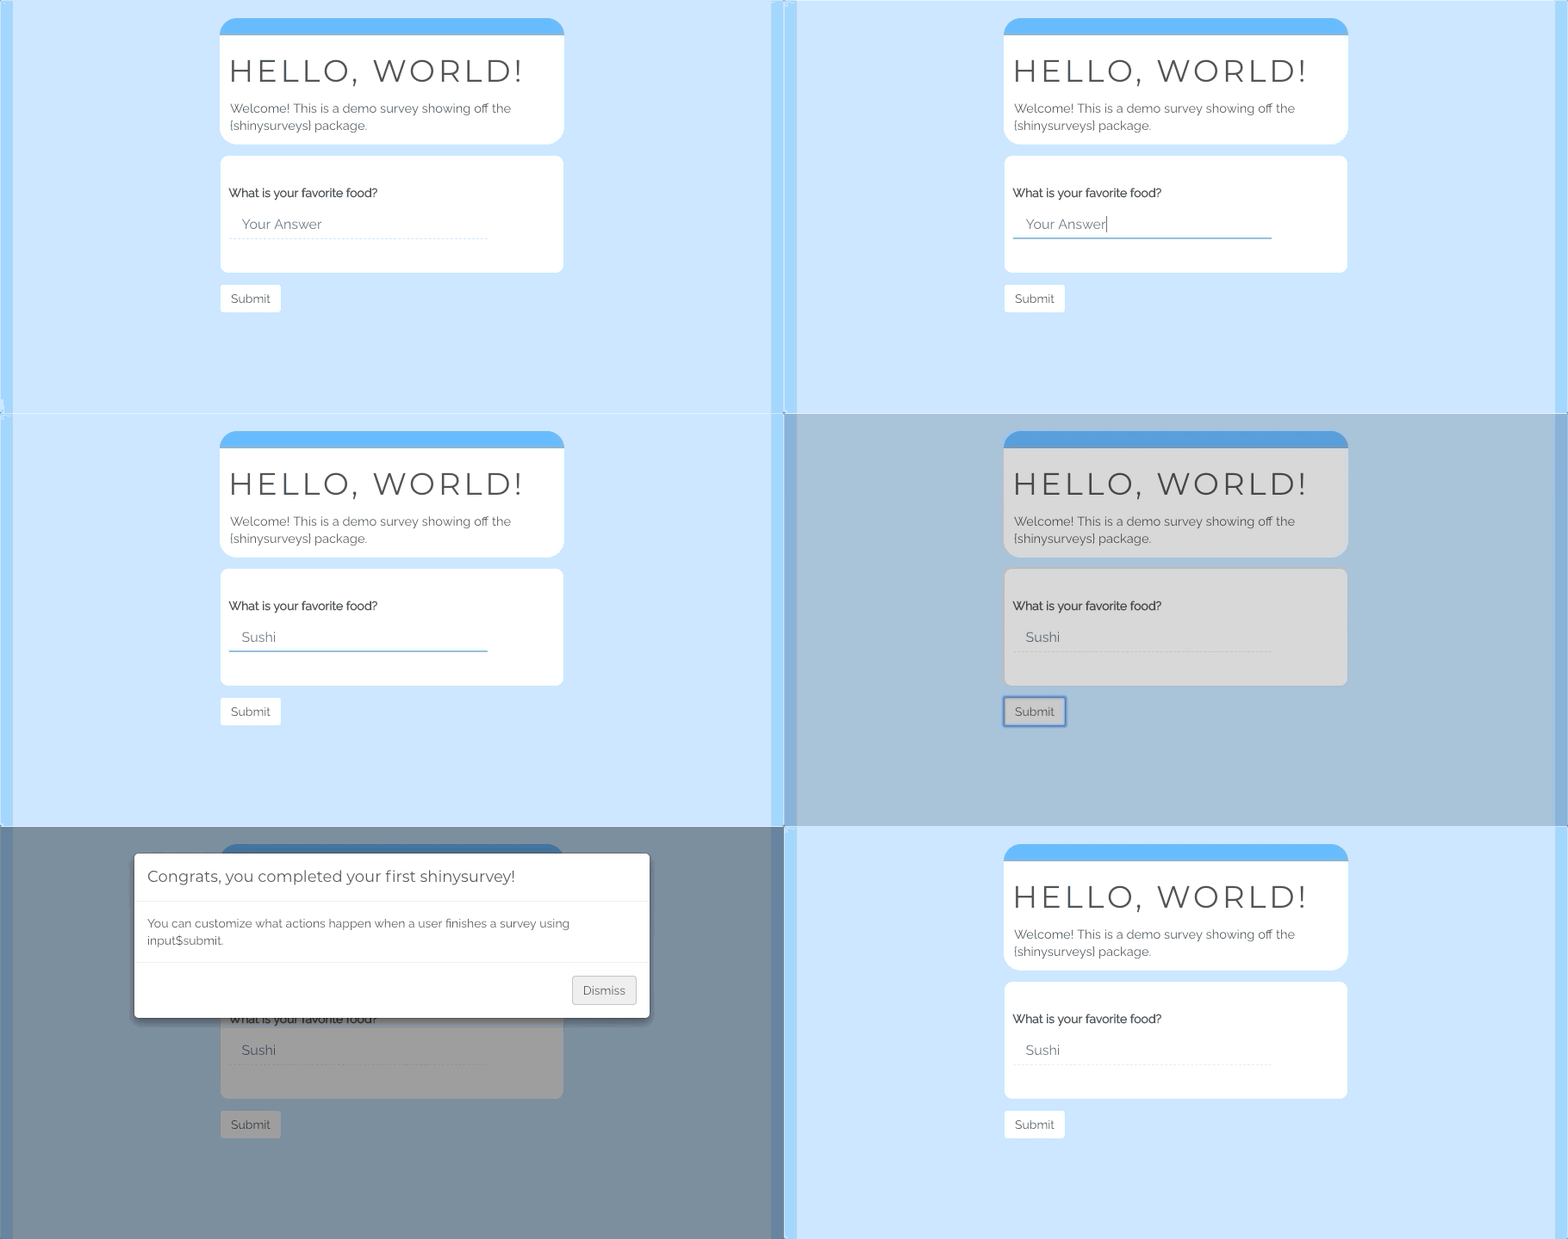
library(shinysurveys)A survey made with our package might look like this:

You can run a demo survey with the function
shinysurveys::demo_survey().
Aside from demo_survey(), {shinysurveys} exports two
functions: surveyOutput() and renderSurvey().
The former goes in the UI portion of a Shiny app, and the latter goes in
the server portion. To create a survey, you can build a data frame with
your questions. The following columns are required.
numeric, mc for
multiple choice, text, select, and
y/n for yes/no questions.Our demo survey can be created as follows:
library(shiny)
library(shinysurveys)

df <- data.frame(question = "What is your favorite food?",
                 option = "Your Answer",
                 input_type = "text",
                 input_id = "favorite_food",
                 dependence = NA,
                 dependence_value = NA,
                 required = F)

ui <- fluidPage(
  surveyOutput(df = df,
               survey_title = "Hello, World!",
               survey_description = "Welcome! This is a demo survey showing off the {shinysurveys} package.")
)

server <- function(input, output, session) {
  renderSurvey()

  observeEvent(input$submit, {
    showModal(modalDialog(
      title = "Congrats, you completed your first shinysurvey!",
      "You can customize what actions happen when a user finishes a survey using input$submit."
    ))
  })
}

shinyApp(ui, server)Dependencies can be added so a specific question
will appear based on a participant’s answer to preceding questions. The
dependence column takes an input_id of a preceding question
and, if the participant answers with the value in
dependence_value, the new question will be shown.
Required questions can be specified by adding
the value TRUE to the required column. If a
required question is not answered, the user will not be able to submit
their responses.
URL-based user tracking functionality lets you
keep track of participants easily and systematically. If you deploy your
survey on shinyapps.io, or run
it locally in a browser, you can add a URL parameter after the backslash
as follows: ?user_id=UNIQUE_ID. A live demo can be found
here:
https://jdtrat-apps.shinyapps.io/shinysurveys_user_tracking/?user_id=hadley
Multi-paged surveys can be used to better
organize questions and make it easier for people to complete. As of
v0.2.0., users can add an additional column page to the data frame of
questions. The column can either have numeric
(e.g. c(1, 1, 2, 3) or character
(c("intro", "intro", "middle", "final")) values. For more
documentation, see my blog
post.
Automatic response aggregation to easily gather
participant’s data upon submission with getSurveyData().
See the official
vignette for more details.
For a more in-depth explanation of {shinysurveys}, please see the vignette A survey of {shinysurveys}.
If you want to see a feature, or report a bug, please file an issue or open a pull-request! As this package is just getting off the ground, we welcome all feedback and contributions. See our contribution guidelines for more details on getting involved!
Please note that the shinysurveys project is released with a Contributor Code of Conduct. By contributing to this project, you agree to abide by its terms.
These binaries (installable software) and packages are in development.
They may not be fully stable and should be used with caution. We make no claims about them.