The hardware and bandwidth for this mirror is donated by METANET, the Webhosting and Full Service-Cloud Provider.
If you wish to report a bug, or if you are interested in having us mirror your free-software or open-source project, please feel free to contact us at mirror[@]metanet.ch.

sorvi package was originally intended for hosting various algorithms for Finnish open goverment data in R. After being superseded by later rOpenGov packages that are more specialized in scope (such as geofi, hetu and pxweb), sorvi has now found a new life in hosting various functions that are helpful in rOpenGov package maintenance, authoring and preparing presentations.
Originally rOpenGov/sorvi was a fork of juusohaapanen/soRvi-dev but rOpenGov’s sorvi branch has since taken a life of its own. The fork was detached fron juusohaapanen’s branch in November 2021.
You can install the development version of sorvi from GitHub with:
# install.packages("remotes")
remotes::install_github("rOpenGov/sorvi")
Development version can be also installed using the r-universe:
# Enable this universe
options(repos = c(
  ropengov = "https://ropengov.r-universe.dev",
  CRAN = "https://cloud.r-project.org"
))
install.packages("sorvi")
There is still a CRAN release version of sorvi and while it passes CRAN checks without problems it contains mostly outdated functions. It is therefore highly recommended to use development version of the package.
Loading the package in R:
library(sorvi)Get download statistics of eurostat-package, by year:
df <- cran_downloads(pkgs = "eurostat", sum = "by_year", use.cache = FALSE)
df
#> # A tibble: 5 × 3
#> # Groups:   year [5]
#>    year package      n
#>   <dbl> <fct>    <int>
#> 1  2018 eurostat 18932
#> 2  2019 eurostat 28454
#> 3  2020 eurostat 31298
#> 4  2021 eurostat 30307
#> 5  2022 eurostat 27656
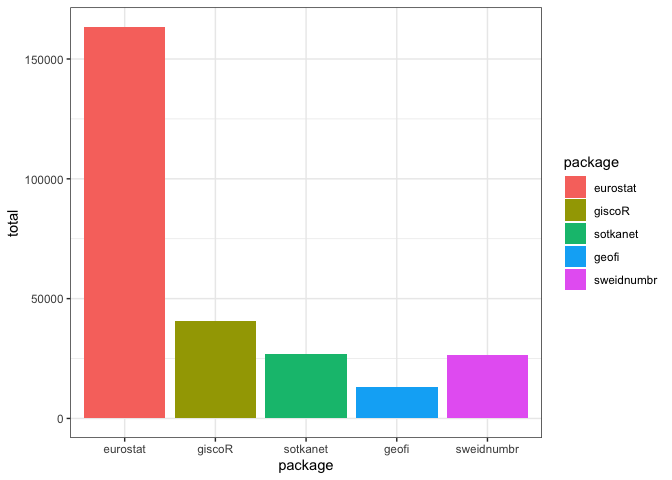
Get download statistics of various rOpenGov packages over time and draw a chart:
packages <- c("eurostat", "giscoR", "sotkanet", "geofi", "sweidnumbr")
plot <- cran_downloads(pkgs = packages, sum = "total", output = "plot", use.cache = FALSE)
plot
For more examples, check the package vignette.
sessionInfo() and packageVersion("sorvi") and
preferably provide a reproducible
example)Kindly cite this work as follows:
Leo Lahti, Juuso Parkkinen, Joona Lehtomaki and Pyry Kantanen (2023). sorvi: Finnish open data toolkit for R. R package version 0.8.21. URL: https://github.com/rOpenGov/sorvi
We are grateful to Jussi Paananen, Einari Happonen, Juuso Haapanen, and all other contributors! This project is part of rOpenGov.
These binaries (installable software) and packages are in development.
They may not be fully stable and should be used with caution. We make no claims about them.