

The hardware and bandwidth for this mirror is donated by METANET, the Webhosting and Full Service-Cloud Provider.
If you wish to report a bug, or if you are interested in having us mirror your free-software or open-source project, please feel free to contact us at mirror[@]metanet.ch.
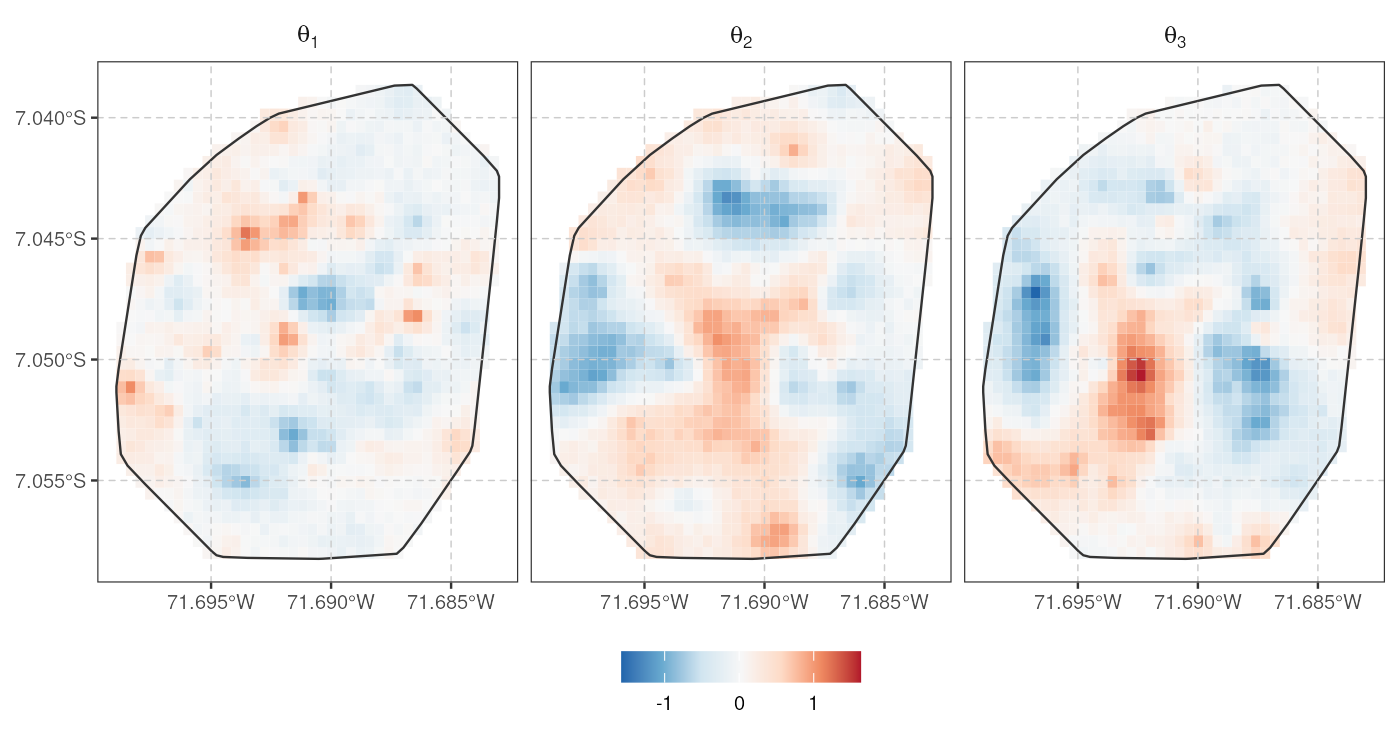
spifa fits spatial item factor analysis (IFA) models for binary responses using full Bayesian inference (adaptive Metropolis-Hastings within Gibbs sampling), via auxiliary variables with a probit link function. The latent factors are modelled as the sum of a predictor effect, a multivariate Gaussian process capturing spatial dependence, and a multivariate non-spatial term, so spatially referenced constructs (e.g. food insecurity or a socioeconomic index measured at survey locations) can be mapped and predicted at new locations. Standard exploratory and confirmatory IFA are supported as particular cases, simply by dropping the spatial structure.
The package implements the methodology described in “Mapping food insecurity in the Brazilian Amazon using a spatial item factor analysis model” (2025), published in The Annals of Applied Statistics at https://doi.org/10.1214/25-AOAS2072. In addition to the core spatial item factor analysis model, spifa offers tools for model diagnostics, visualization, and summarizing results.
You can install the development version from GitHub:
remotes::install_github("ErickChacon/spifa")A minimal spatial item factor analysis fit on the bundled
ipixuna dataset (a simulated sf object with
items responses for geo-referenced households). We define
the discrimination structure and fit the model with the default spatial
structure for each factor:
library(spifa)

data(ipixuna)
nfactors <- 3
nitems <- ncol(ipixuna$items)

# define a restriction for the discrimination
A <- matrix(1, nitems, nfactors)
A[c(4, 8), 1] <- 0
A[c(4, 5, 6, 7, 8, 10), 2] <- 0
A[c(5, 6), 3] <- 0

# sampling from the posterior distribution
samples <- spifa(items ~ 1, data = ipixuna, nfactors = nfactors, niter = 1000,
  constraints = list(discrimination = A))

# visualize the easiness parameters (c)
plot(samples, select = "c", burnin = 500)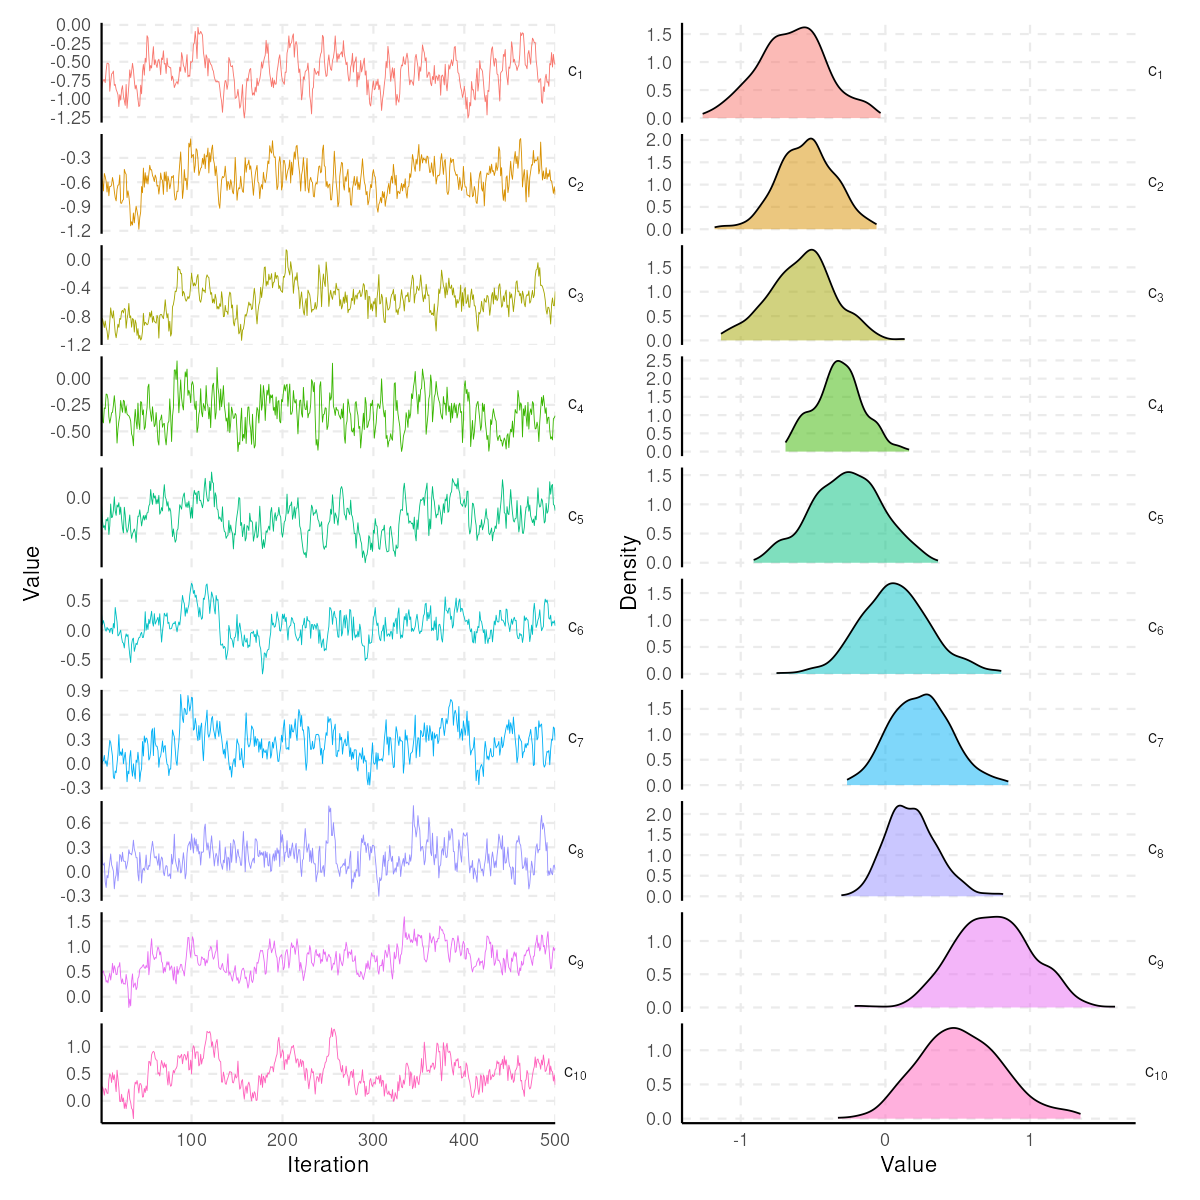
See vignette("spifa") for a full worked example.
If you use spifa in your work, please cite both the paper that proposes the underlying model and the package itself:
Chacón-Montalván, E. A., Parry, L., Giorgi, E., Torres, P., Orellana, J. D. Y., Moraga, P., and Taylor, B. M. (2025). Mapping food insecurity in the Brazilian Amazon using a spatial item factor analysis model. The Annals of Applied Statistics, 19(4), 3438-3463. https://doi.org/10.1214/25-AOAS2072
citation("spifa")These binaries (installable software) and packages are in development.
They may not be fully stable and should be used with caution. We make no claims about them.