
The hardware and bandwidth for this mirror is donated by METANET, the Webhosting and Full Service-Cloud Provider.
If you wish to report a bug, or if you are interested in having us mirror your free-software or open-source project, please feel free to contact us at mirror[@]metanet.ch.



stratigraphr is a tidy framework for working with archaeological stratigraphy and chronology in R. It includes tools for reading, analysing, and visualising stratigraphic sequences (Harris matrices) and as directed graphs and an R interface to OxCal’s Chronological Query Language (CQL).
You can install the latest release of era from CRAN with:
install.packages("stratigraphr")Or install the development version from GitHub with pak:
# install.packages("pak")
devtools::install_github("joeroe/stratigraphr")stratigraph() uses a data frame of stratigraphic
relations to construct a stratigraphic graph:
library(stratigraphr)

# Example stratigraphy from Harris (1979), figure 12:
harris12
#>    context   above   below equal
#> 1        1      NA 2, 3, 4  <NA>
#> 2        2       1       5  <NA>
#> 3        3       1       5  <NA>
#> 4        4       1       5  <NA>
#> 5        5 2, 3, 4       6  <NA>
#> 6        6       5    7, 8  <NA>
#> 7        7       6       9     8
#> 8        8       6       9     7
#> 9        9    7, 8 natural  <NA>
#> 10 natural       9      NA  <NA>

stratigraph(harris12, "context", "above")
#> # A stratigraph: 10 units and 12 relations
#> # ✔ Valid stratigraphic graph
#>                 1
#> ┌───────────────┼───────────────┐
#> 2               3               4
#> └───────────────┼───────────────┘
#>                 5
#>                 │
#>                 6
#>         ┌───────┴───────┐
#>         7               8
#>         └───────┬───────┘
#>                 9
#>                 │
#>              natural
stratigraph objects are built on top of tidygraph, which gives access to a powerful tidy interface for manipulating and analysing the stratigraphy. It also works seamlessly with ggraph. For example, to approximate a conventional ‘Harris matrix’ visualisation with ggraph:
library("ggraph")
#> Loading required package: ggplot2

# Example data after Harris 1979, Fig. 12
harris12 |>
  stratigraph("context", "above") |>
  ggraph(layout = "sugiyama") +
    geom_edge_elbow() +
    geom_node_label(aes(label = context), label.r = unit(0, "mm")) +
    theme_graph()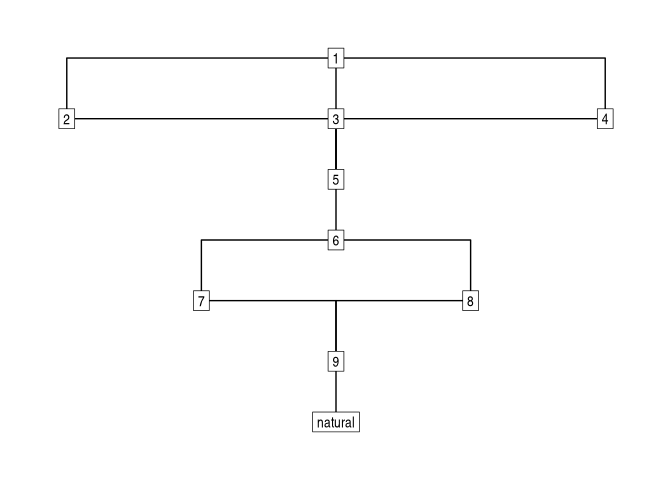
For further information on:
vignette("stratigraphr").vignette("cql").This package previous contained functions for tidy radiocarbon data. These were deprecated in v0.3.0 and moved to the c14 package. See c14’s introductory vignette for further information.
These binaries (installable software) and packages are in development.
They may not be fully stable and should be used with caution. We make no claims about them.