The hardware and bandwidth for this mirror is donated by METANET, the Webhosting and Full Service-Cloud Provider.
If you wish to report a bug, or if you are interested in having us mirror your free-software or open-source project, please feel free to contact us at mirror[@]metanet.ch.
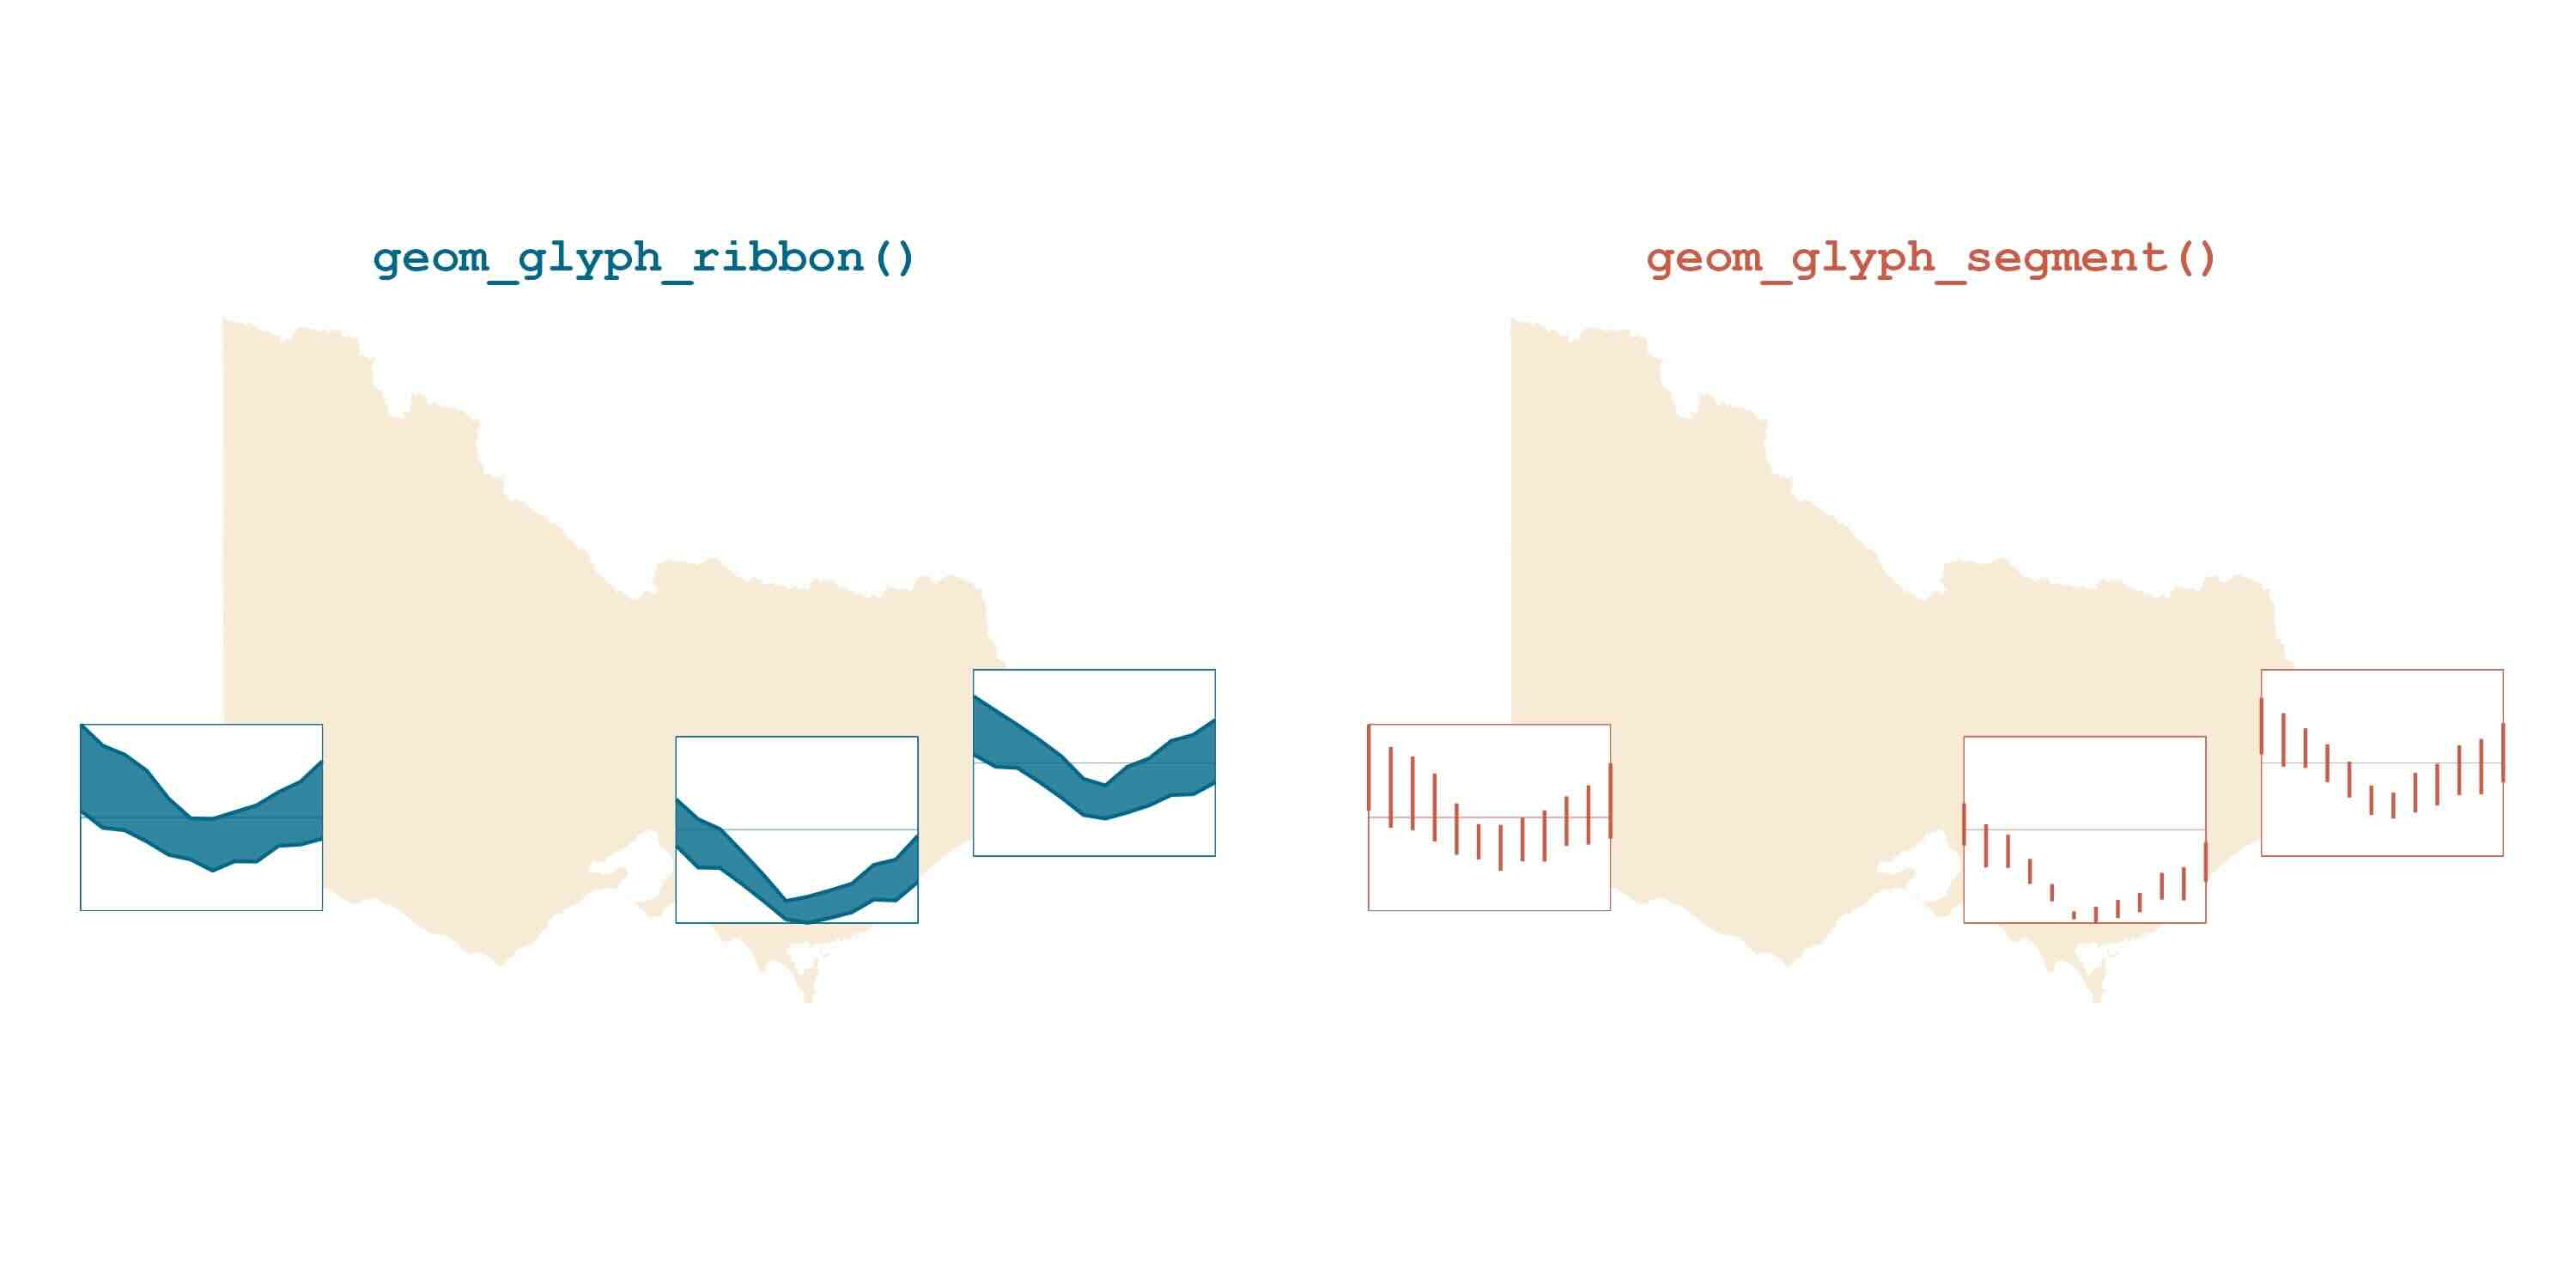
sugarglider provides ggplot2 extensions to create glyph
maps that visualize seasonal aspects of spatio-temporal data with
geom_glyph_ribbon() and
geom_glyph_segment().
These functions create a ribbon or segment geometry designed to
display glyphs based on the combination of x_major and
y_major. For each x_minor value,
geom_glyph_ribbon() displays a y interval defined by
ymin_minor and ymax_minor. Meanwhile,
geom_glyph_segment() draws a straight line between
y_minor and yend_minor with respect to
x_minor.

# Download the development version from GitHub:
devtools::install_github("maliny12/sugarglider")See the examples page to learn more about how to use sugarglider in your project.
These binaries (installable software) and packages are in development.
They may not be fully stable and should be used with caution. We make no claims about them.