The hardware and bandwidth for this mirror is donated by METANET, the Webhosting and Full Service-Cloud Provider.
If you wish to report a bug, or if you are interested in having us mirror your free-software or open-source project, please feel free to contact us at mirror[@]metanet.ch.

The goal of syrup is to measure memory and CPU usage of R code by
regularly taking snapshots of calls to the system command
ps. The package provides an entry point (albeit coarse) to
profile usage of system resources by R code run in parallel.
The package name is an homage to syrupy (SYstem Resource Usage Profile …um, Yeah), a Python tool at jeetsukumaran/Syrupy.
Install the latest release of syrup from CRAN like so:
install.packages("syrup")You can install the development version of syrup like so:
pak::pak("simonpcouch/syrup")library(syrup)
#> Loading required package: benchThe main function in the syrup package is the function by the same
name. The main argument to syrup() is an expression, and
the function outputs a tibble. Supplying a rather boring expression:
syrup(Sys.sleep(1))
#> # A tibble: 48 × 8
#>       id time                  pid  ppid name           pct_cpu       rss    vms
#>    <dbl> <dttm>              <int> <int> <chr>            <dbl> <bch:byt> <bch:>
#>  1     1 2024-07-03 11:42:33 67101 60522 R                   NA     112MB  392GB
#>  2     1 2024-07-03 11:42:33 60522 60300 rsession-arm64      NA     653MB  394GB
#>  3     1 2024-07-03 11:42:33 58919     1 R                   NA     773MB  393GB
#>  4     1 2024-07-03 11:42:33 97009     1 rsession-arm64      NA     128KB  394GB
#>  5     1 2024-07-03 11:42:33 97008     1 rsession-arm64      NA     128KB  394GB
#>  6     1 2024-07-03 11:42:33 97007     1 rsession-arm64      NA     240KB  394GB
#>  7     1 2024-07-03 11:42:33 97006     1 rsession-arm64      NA     240KB  394GB
#>  8     1 2024-07-03 11:42:33 97005     1 rsession-arm64      NA     128KB  394GB
#>  9     1 2024-07-03 11:42:33 91012     1 R                   NA     128KB  393GB
#> 10     1 2024-07-03 11:42:33 90999     1 R                   NA     128KB  393GB
#> # ℹ 38 more rows
In this tibble, id defines a specific time point at
which process usage was snapshotted, and the remaining columns show
output derived from ps::ps(). Notably,
pid is the process ID, ppid is the process ID
of the parent process, pct_cpu is the percent CPU usage,
and rss is the resident set size (a measure of memory
usage).
The function works by:
sesh that queries memory
information at a regular interval,sesh,sesh, and thenFor a more interesting demo, we’ll tune a regularized linear model using cross-validation with tidymodels. First, loading needed packages:
library(future)
library(tidymodels)
library(rlang)
Using future to define our parallelism strategy, we’ll set
plan(multicore, workers = 5), indicating that we’d like to
use forking with 5 workers. By default, future disables forking from
RStudio; I know that, in the context of building this README, this usage
of forking is safe, so I’ll temporarily override that default with
parallelly.fork.enable.
local_options(parallelly.fork.enable = TRUE)
plan(multicore, workers = 5)
Now, simulating some data:
set.seed(1)
dat <- sim_regression(1000000)

dat
#> # A tibble: 1,000,000 × 21
#>    outcome predictor_01 predictor_02 predictor_03 predictor_04 predictor_05
#>      <dbl>        <dbl>        <dbl>        <dbl>        <dbl>        <dbl>
#>  1    3.63       -1.88        0.872       -0.799       -0.0379       2.68
#>  2   41.6         0.551      -2.47         2.37         3.90         5.18
#>  3   -6.99       -2.51       -3.15         2.61         2.13         3.08
#>  4   33.2         4.79        1.86        -2.37         4.27        -3.59
#>  5   34.3         0.989      -0.315        3.08         2.56        -5.91
#>  6   26.7        -2.46       -0.459        1.75        -5.24         5.04
#>  7   21.4         1.46       -0.674       -0.894       -3.91        -3.38
#>  8   21.7         2.21        1.28        -1.05        -0.561        2.99
#>  9   -8.84        1.73        0.0725       0.0976       5.40         4.30
#> 10   24.5        -0.916      -0.223       -0.561       -4.12         0.0508
#> # ℹ 999,990 more rows
#> # ℹ 15 more variables: predictor_06 <dbl>, predictor_07 <dbl>,
#> #   predictor_08 <dbl>, predictor_09 <dbl>, predictor_10 <dbl>,
#> #   predictor_11 <dbl>, predictor_12 <dbl>, predictor_13 <dbl>,
#> #   predictor_14 <dbl>, predictor_15 <dbl>, predictor_16 <dbl>,
#> #   predictor_17 <dbl>, predictor_18 <dbl>, predictor_19 <dbl>,
#> #   predictor_20 <dbl>
The call to tune_grid() does some setup sequentially
before sending data off to the five child processes to actually carry
out the model fitting. After models are fitted, data is sent back to the
parent process to be combined. To better understand system resource
usage throughout that process, we wrap the call in
syrup():
res_mem <- syrup({
  res <-
    tune_grid(
      linear_reg(engine = "glmnet", penalty = tune()),
      outcome ~ .,
      vfold_cv(dat)
    )
})

res_mem
#> # A tibble: 158 × 8
#>       id time                  pid  ppid name           pct_cpu       rss    vms
#>    <dbl> <dttm>              <int> <int> <chr>            <dbl> <bch:byt> <bch:>
#>  1     1 2024-07-03 11:42:38 67101 60522 R                   NA    1.05GB  393GB
#>  2     1 2024-07-03 11:42:38 60522 60300 rsession-arm64      NA  653.44MB  394GB
#>  3     1 2024-07-03 11:42:38 58919     1 R                   NA  838.56MB  393GB
#>  4     1 2024-07-03 11:42:38 97009     1 rsession-arm64      NA     128KB  394GB
#>  5     1 2024-07-03 11:42:38 97008     1 rsession-arm64      NA     128KB  394GB
#>  6     1 2024-07-03 11:42:38 97007     1 rsession-arm64      NA     240KB  394GB
#>  7     1 2024-07-03 11:42:38 97006     1 rsession-arm64      NA     240KB  394GB
#>  8     1 2024-07-03 11:42:38 97005     1 rsession-arm64      NA     128KB  394GB
#>  9     1 2024-07-03 11:42:38 91012     1 R                   NA     128KB  393GB
#> 10     1 2024-07-03 11:42:38 90999     1 R                   NA     128KB  393GB
#> # ℹ 148 more rows
These results are a bit more interesting than the sequential results
from Sys.sleep(1). Look closely at the ppids
for each id; after a snapshot or two, you’ll see five
identical ppids for each id, and those
ppids match up with the remaining pid in the
one remaining R process. This shows us that we’ve indeed distributed
computations using forking in that that one remaining R process, the
“parent,” has spawned off five child processes from itself.
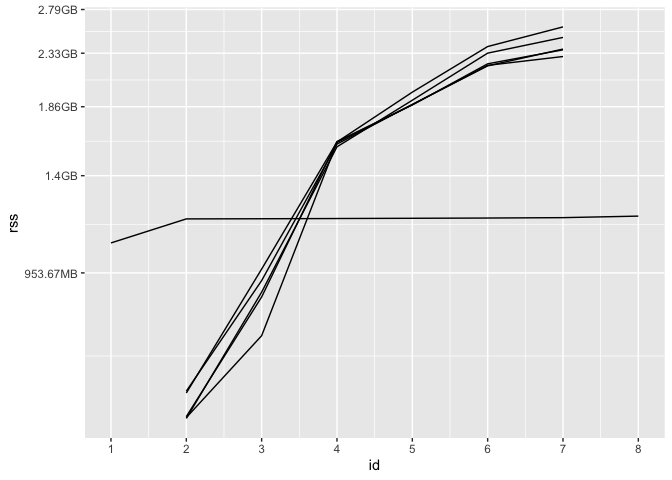
We can plot the result to get a better sense of how memory usage of these processes changes over time:
worker_ppid <- ps::ps_pid()

res_mem %>%
  filter(ppid == worker_ppid | pid == worker_ppid) %>%
  ggplot() +
  aes(x = id, y = rss, group = pid) +
  geom_line() +
  scale_x_continuous(breaks = 1:max(res_mem$id))
At first, only the parent process has non-NA
rss, as tidymodels hasn’t sent data off to any workers yet.
Then, each of the 5 workers receives data from tidymodels and begins
fitting models. Eventually, each of those workers returns their results
to the parent process, and their rss is once again
NA. The parent process wraps up its computations before
completing evaluation of the expression, at which point
syrup() returns. (Keep in mind: memory is weird. In the
above plot, the total memory allotted to the parent session and its five
workers at each ID is not simply the sum of those rss
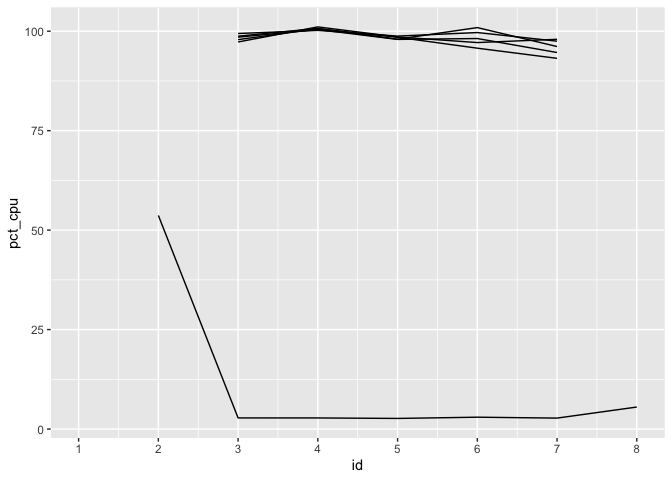
values, as memory is shared among them.) We see a another side of the
story come together for CPU usage:
res_mem %>%
  filter(ppid == worker_ppid | pid == worker_ppid) %>%
  ggplot() +
  aes(x = id, y = pct_cpu, group = pid) +
  geom_line() +
  scale_x_continuous(breaks = 1:max(res_mem$id))
The percent CPU usage will always be NA the first time a
process ID is seen, as the usage calculation is based on change since
the previous recorded value. As soon as we’re able to start measuring,
we see the workers at 100% usage, while the parent process is largely
idle once it has sent data off to workers.
While much of the verbiage in the package assumes that the supplied
expression will be distributed across CPU cores, there’s nothing
specific about this package that necessitates the expression provided to
syrup() is run in parallel. Said another way, syrup will
work just fine with “normal,” sequentially-run R code. That said, there
are many better, more fine-grained tools for the job in the case of
sequential R code, such as Rprofmem(), the profmem package,
the bench package, and packages
in the R-prof GitHub
organization.
Results from syrup only provide enough detail for the coarsest analyses of memory and CPU usage, but they do provide an entry point to “profiling” system resource usage for R code that runs in parallel.
These binaries (installable software) and packages are in development.
They may not be fully stable and should be used with caution. We make no claims about them.