
The hardware and bandwidth for this mirror is donated by METANET, the Webhosting and Full Service-Cloud Provider.
If you wish to report a bug, or if you are interested in having us mirror your free-software or open-source project, please feel free to contact us at mirror[@]metanet.ch.


{tastypie} 0.1.0 here!{tastypie} crew and
get a free tasty_tshirt? Find out the details here.You only need to type “why pie charts are bad” on Google
to find thousands of articles full of (very valid) reasons why this type
of chart should not be used.
However,
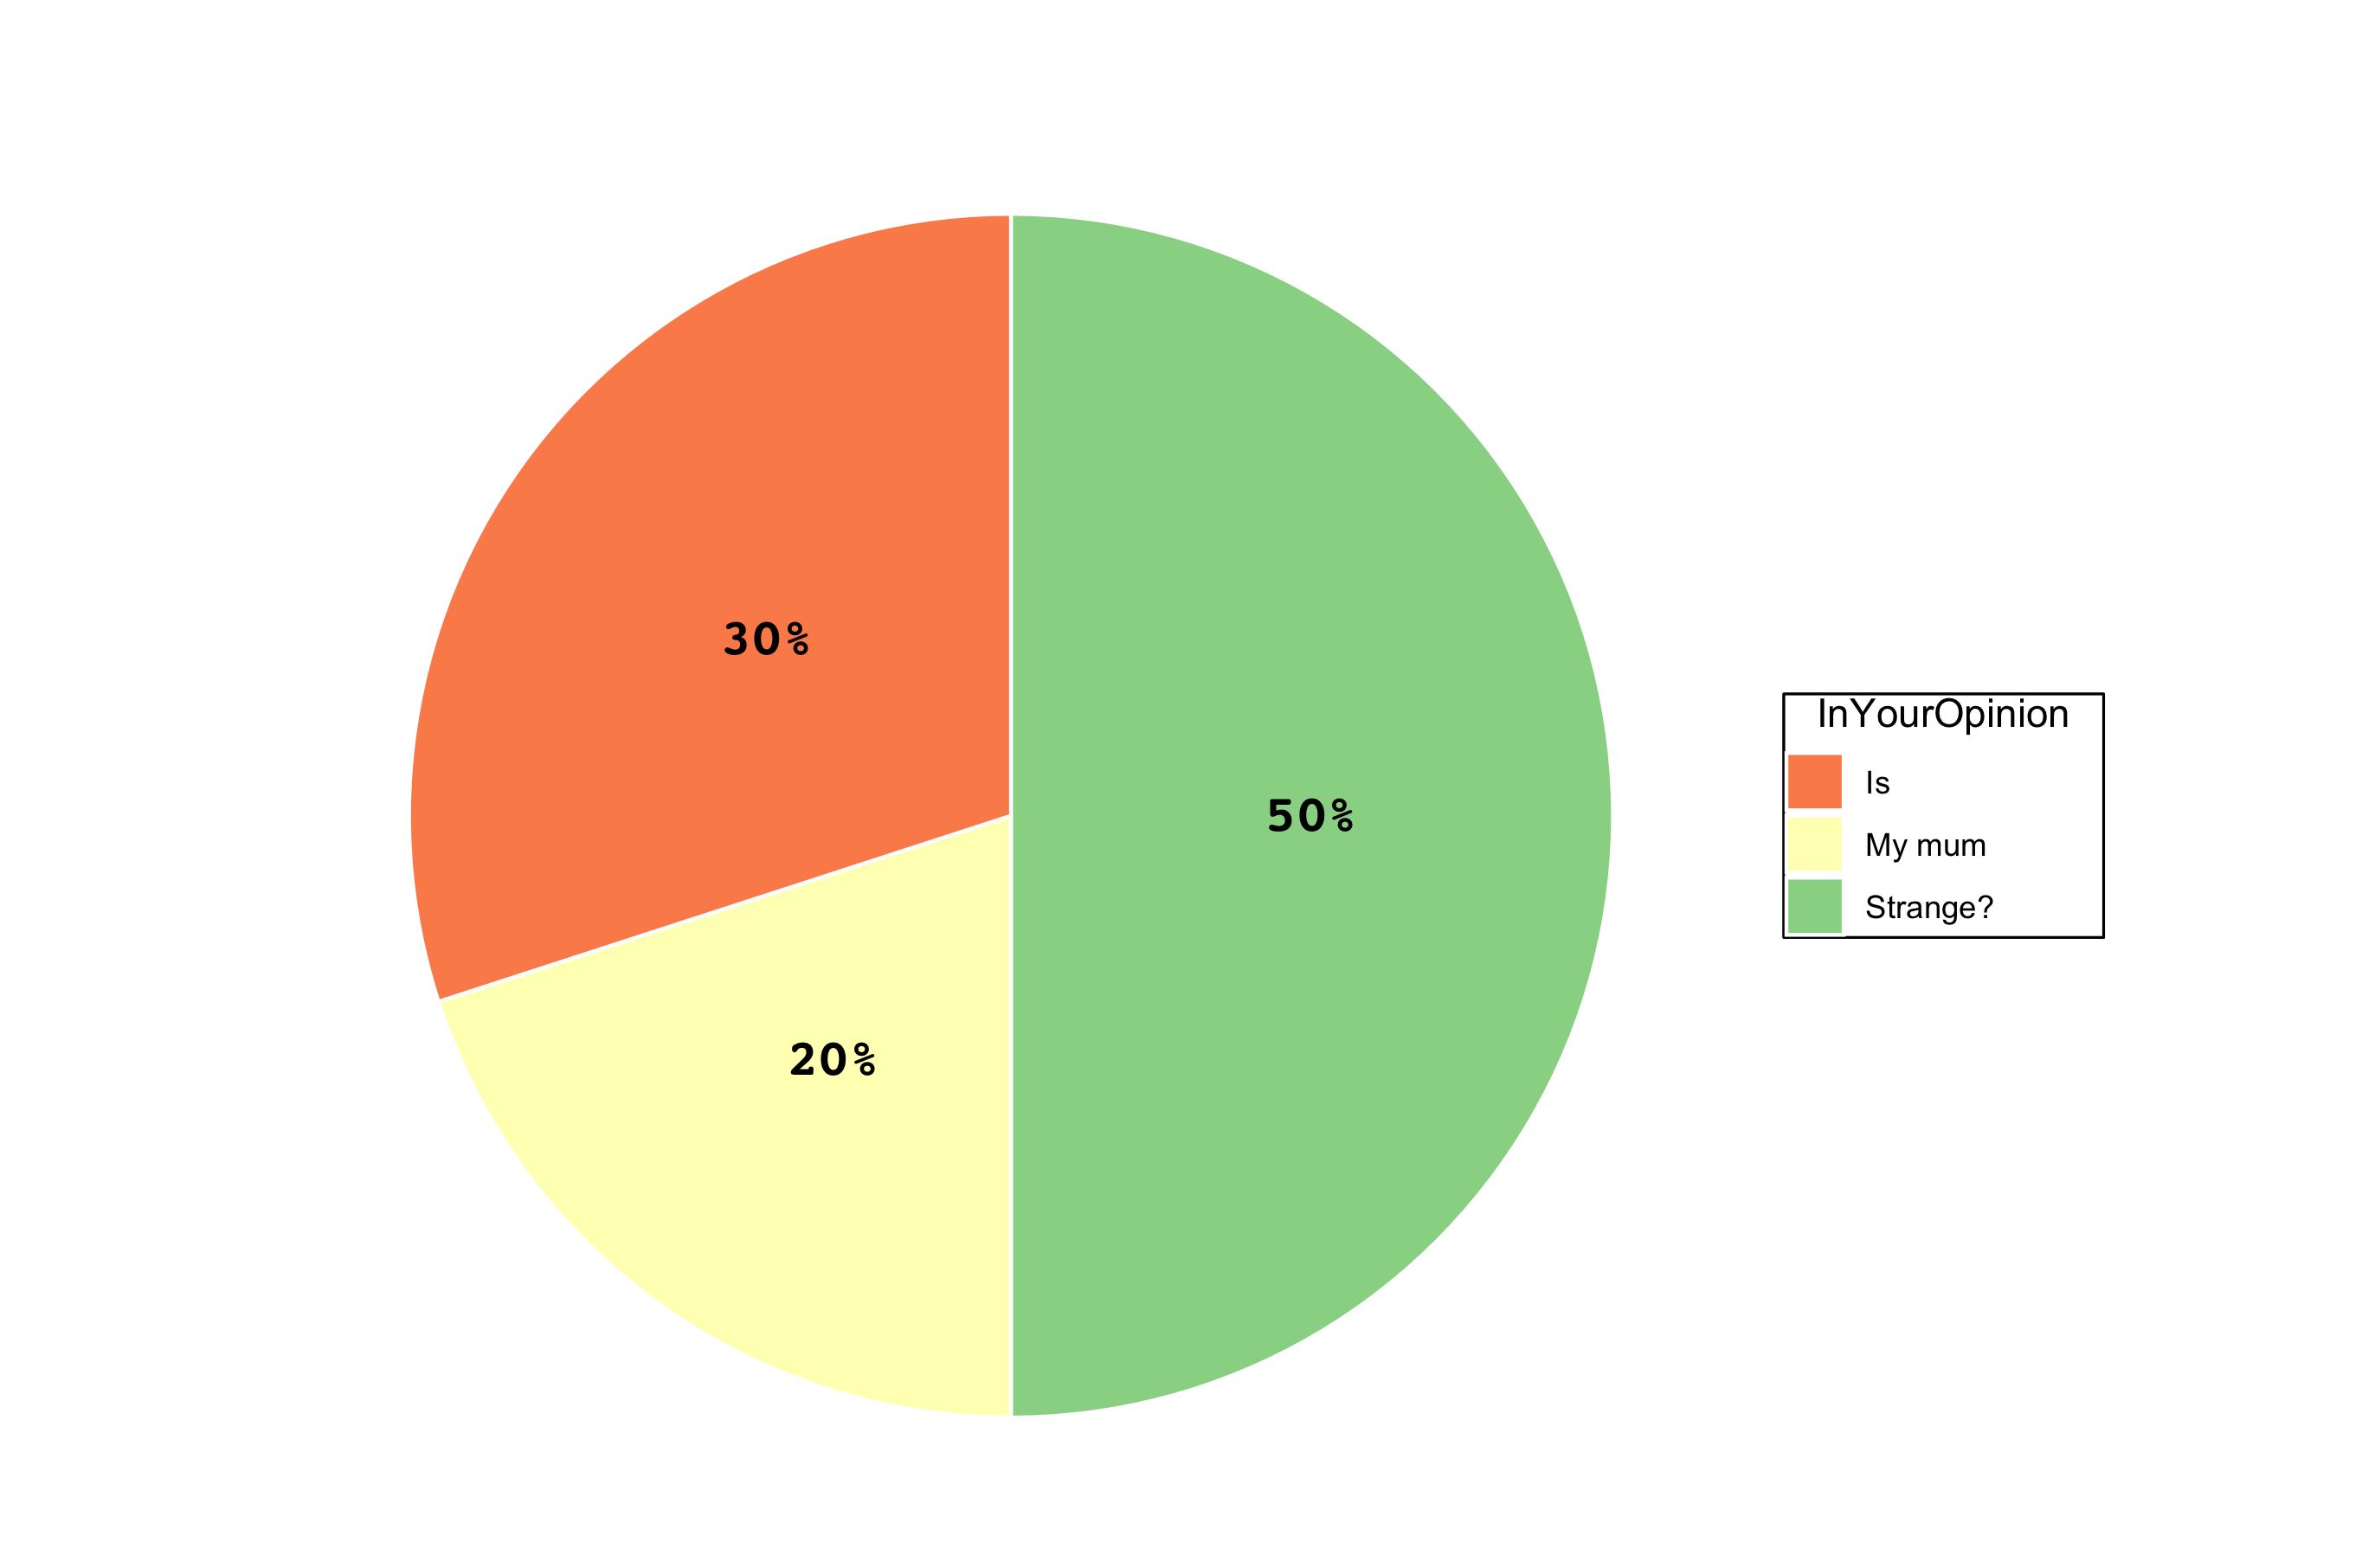
my mother, a high school teacher of Latin and Italian Literature, swears
she understands more from something like this:

than from something like this:
| InYourOpinion | Value | Proportion |
|---|---|---|
| My mum | 60 | 0.2 |
| Is | 90 | 0.3 |
| Strange? | 150 | 0.5 |
Now, I love my mum, and I want her to be happy. Maybe there are other
people in the world with this particular problem, so, why not
help?
Due to the little use because of the already mentioned reasons, making
pie (and related) charts in R is not straightforward, so it is necessary
to have functions to simplify things.
In this R package there are useful functions for making tasty pies exploiting some ggplot2 features.
You can install the released version of {tastypie} from
CRAN with:
install.packages("tastypie")Or, you can install the development version from GitHub with:
# install.packages("devtools")
devtools::install_github("PaoloDalena/tastypie")
Then, you can attach to your session with:
library(tastypie)
#>             $$  $$  $$
#>           __||__||__||__
#>          | * * * * * * *|
#>          |* * * * * * * |
#>          | * * * * * * *|
#>          |______________|
#>  _              _              _
#> | |_  ___  ___ | |_  _ _  ___ |_| ___
#> |  _|| .'||_ -||  _|| | || . || || -_|
#> |_|  |__,||___||_|  |_  ||  _||_||___|
#> |___||_|{tastypie} allows the user to easily
create many different pie charts based on different templates.
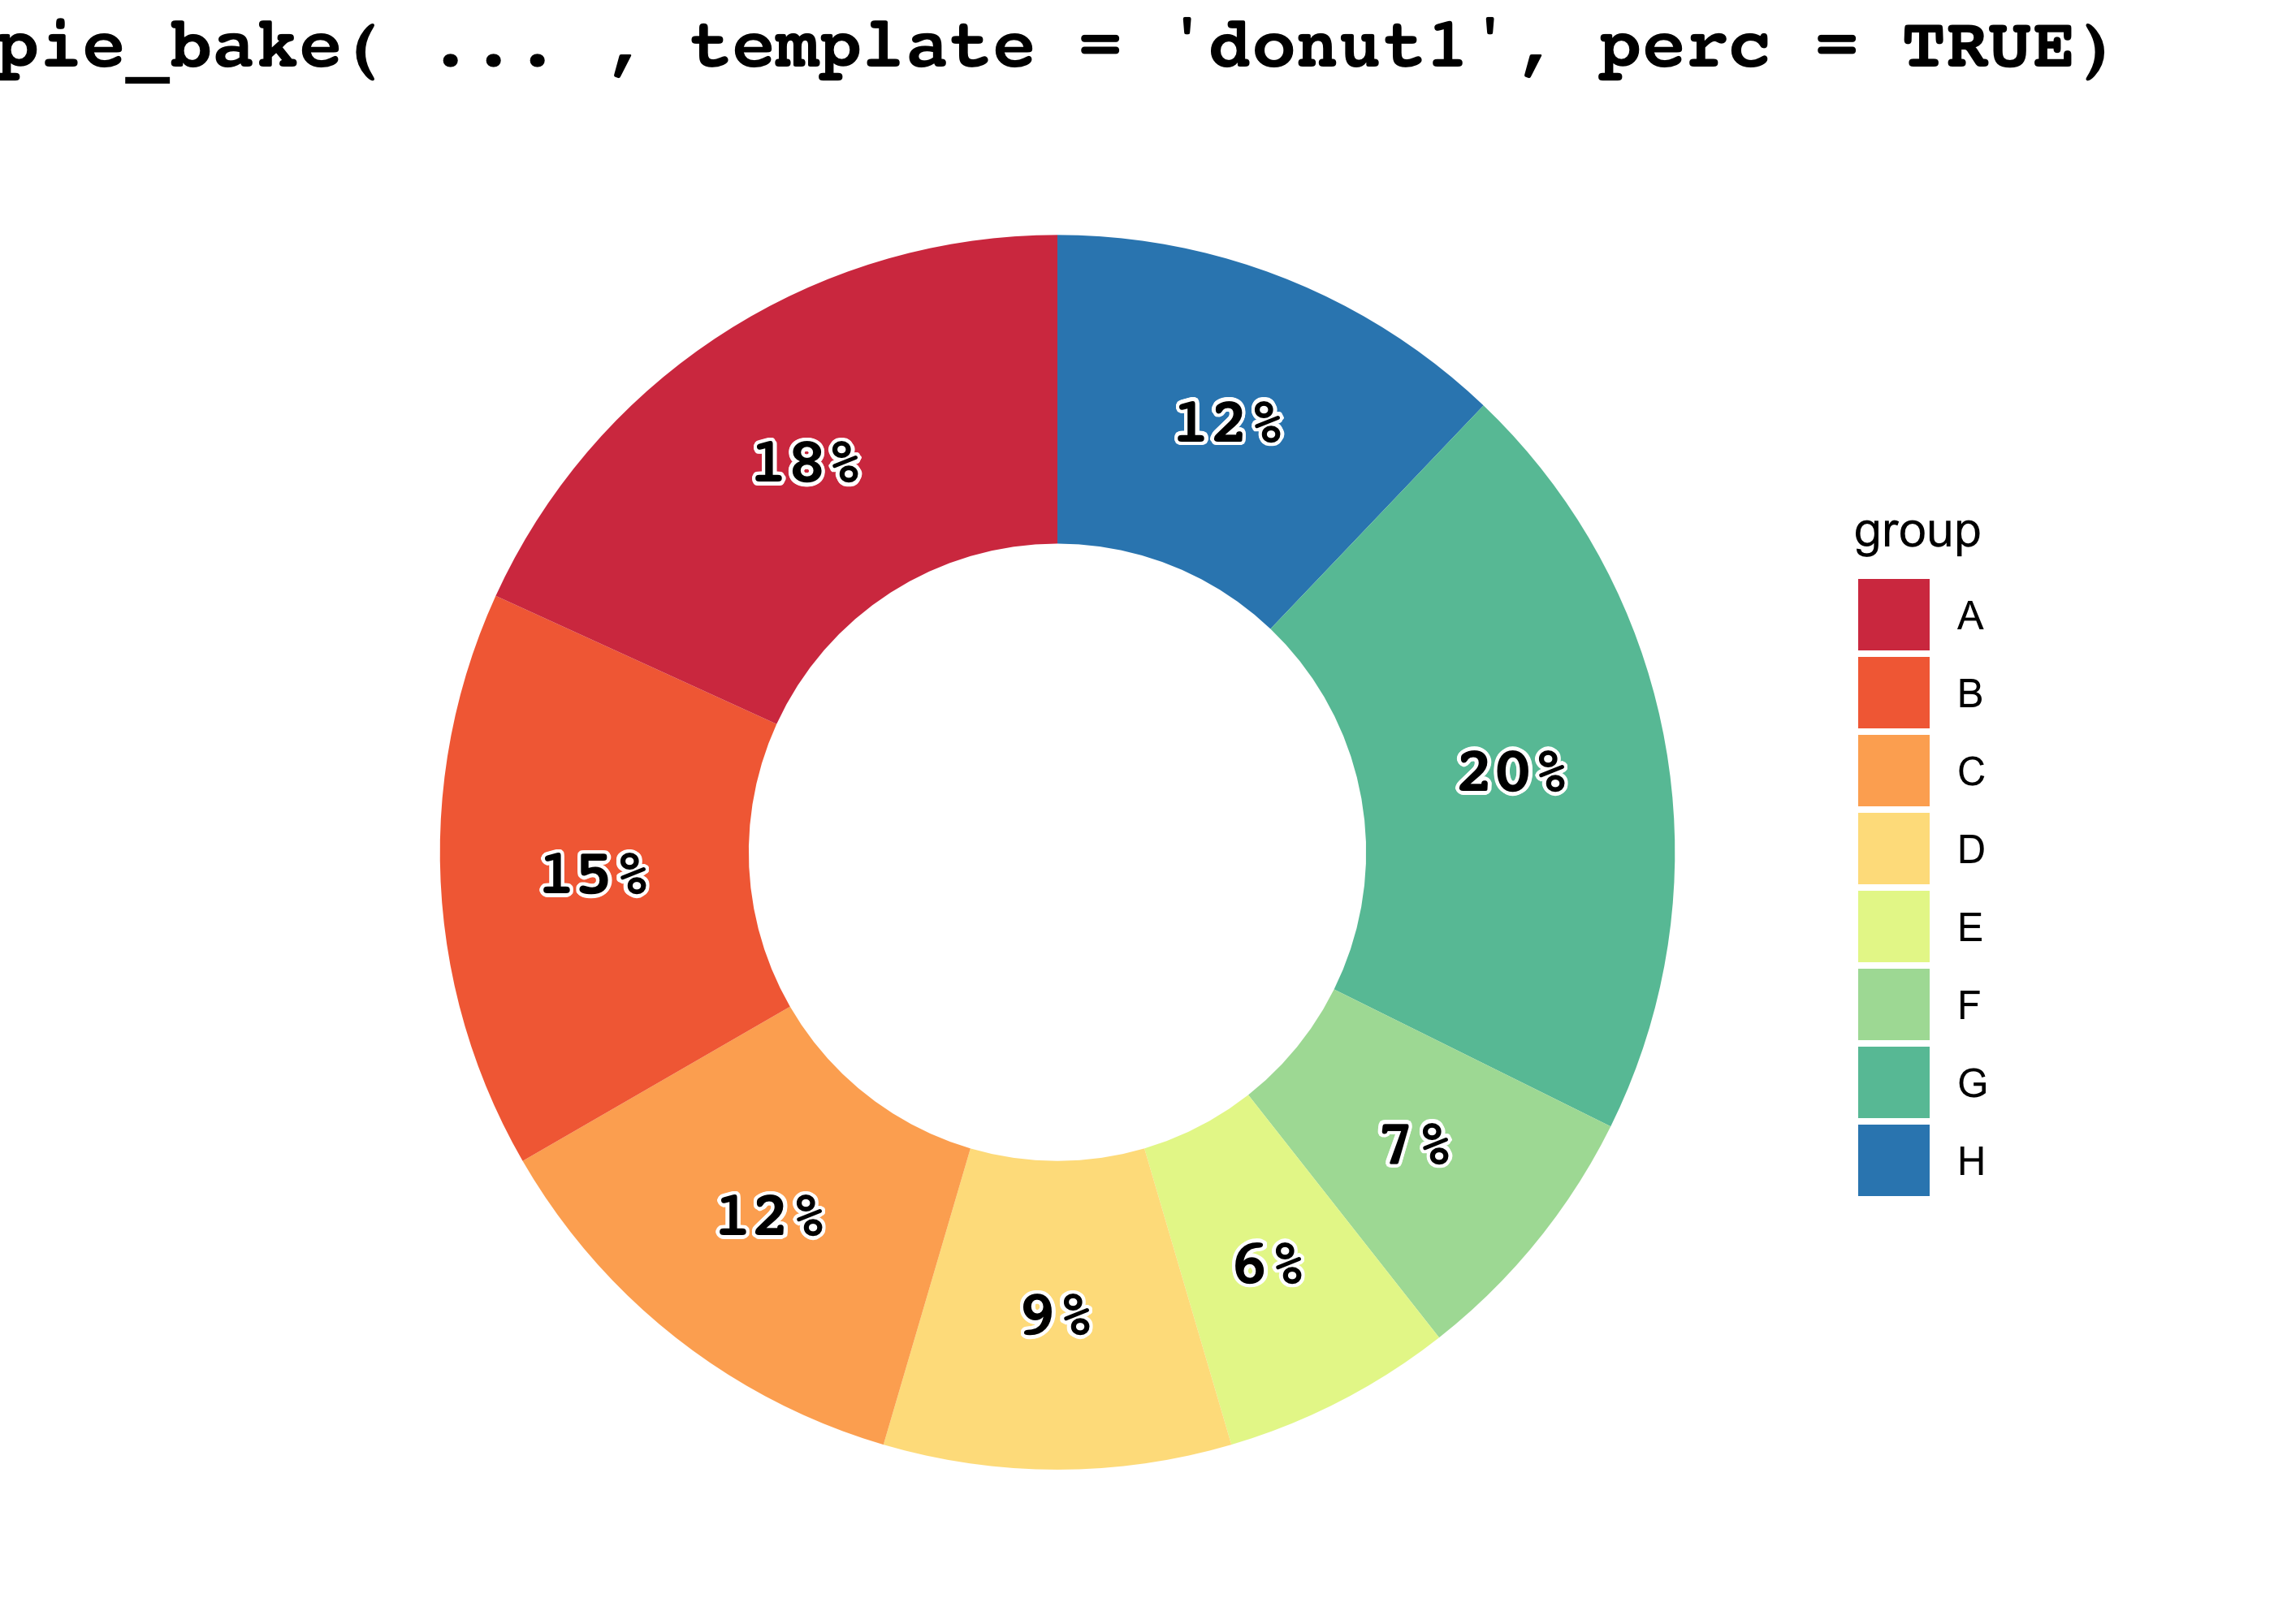
Using pie_bake() you just have to
choose a template and if you want the proportions to be displayed in the
plot or not (if you want, you can also set a title and a group
name):
example <- data.frame(
  c("a. Is", "b. Not", "c. The", "d. Only", "e. One"),
  c(2.9, 6.9, 4.20, 13.12, 6.66)
)

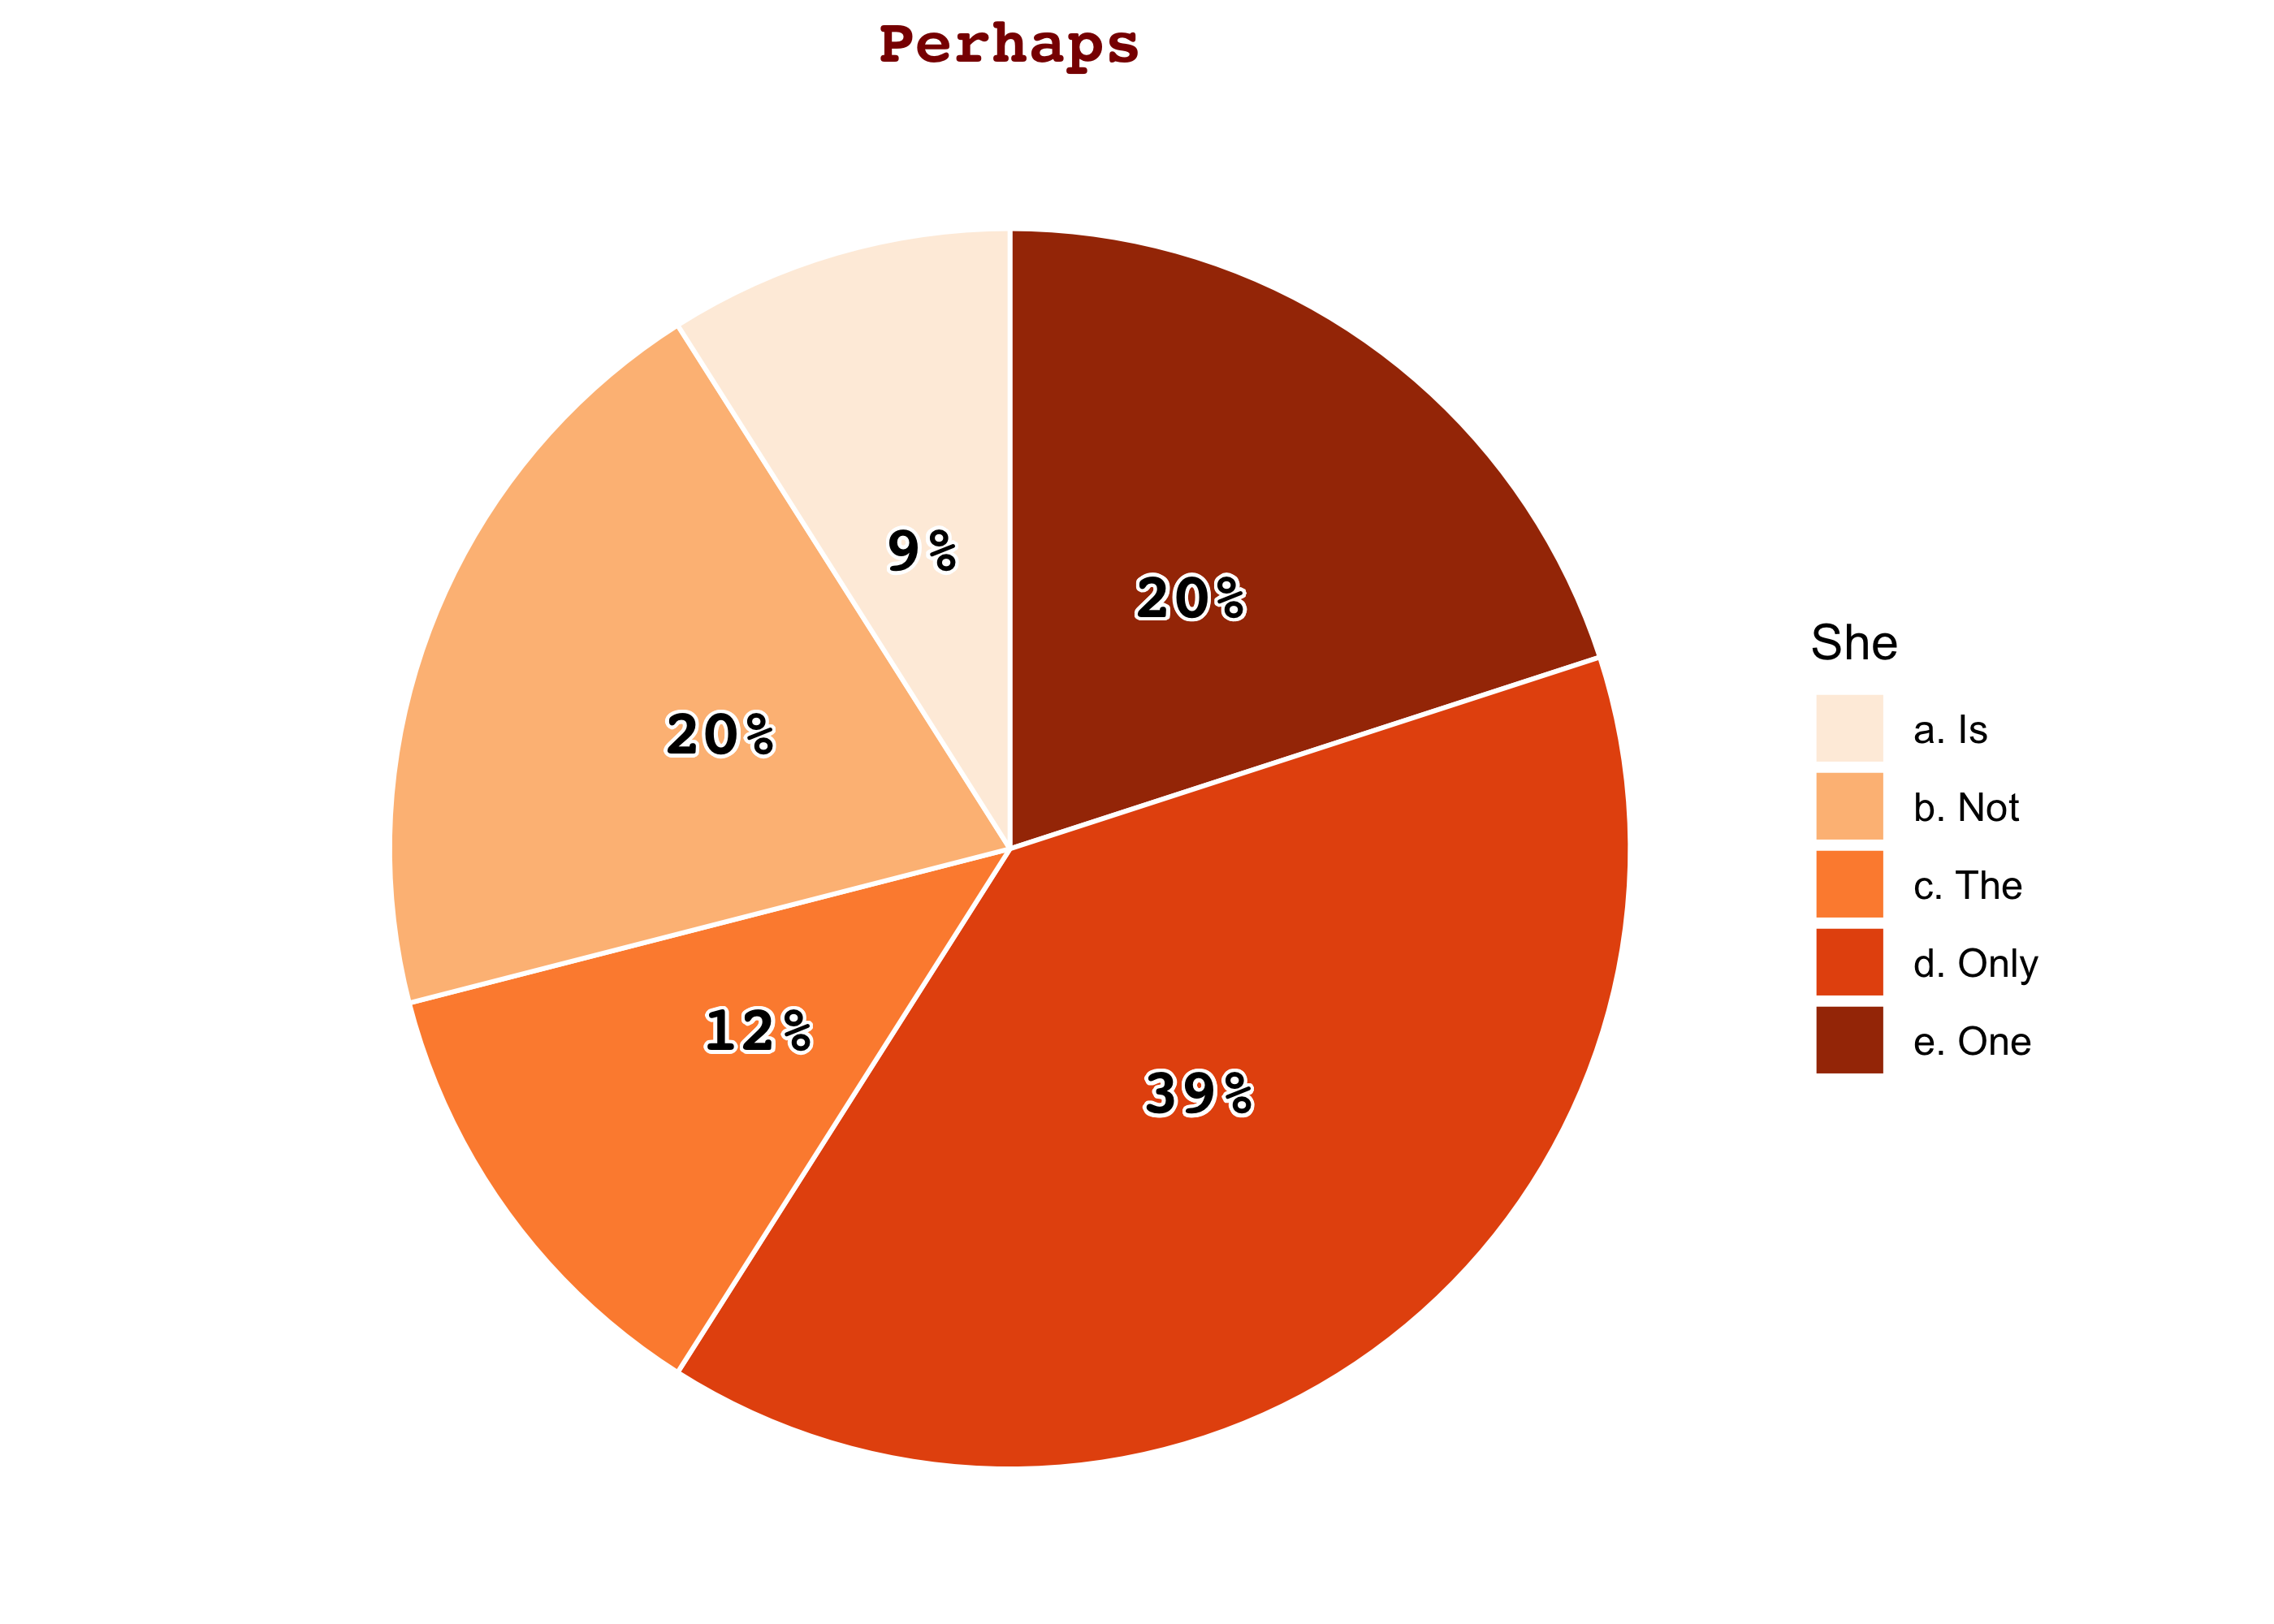
pie_bake(data = example, template = "basic4", perc = TRUE,
         title = "Perhaps", group_name = "She")
pie_bake(data = example, template = "red1", perc = TRUE,
         title = "Perhaps", group_name = "She")
Or, if you want something more extravagant (but probably less
understandable), choose a template and try
pie_bake_pro():
pie_bake_pro(data = example, template = "dart5",
             title = "Perhaps", group_name = "She")
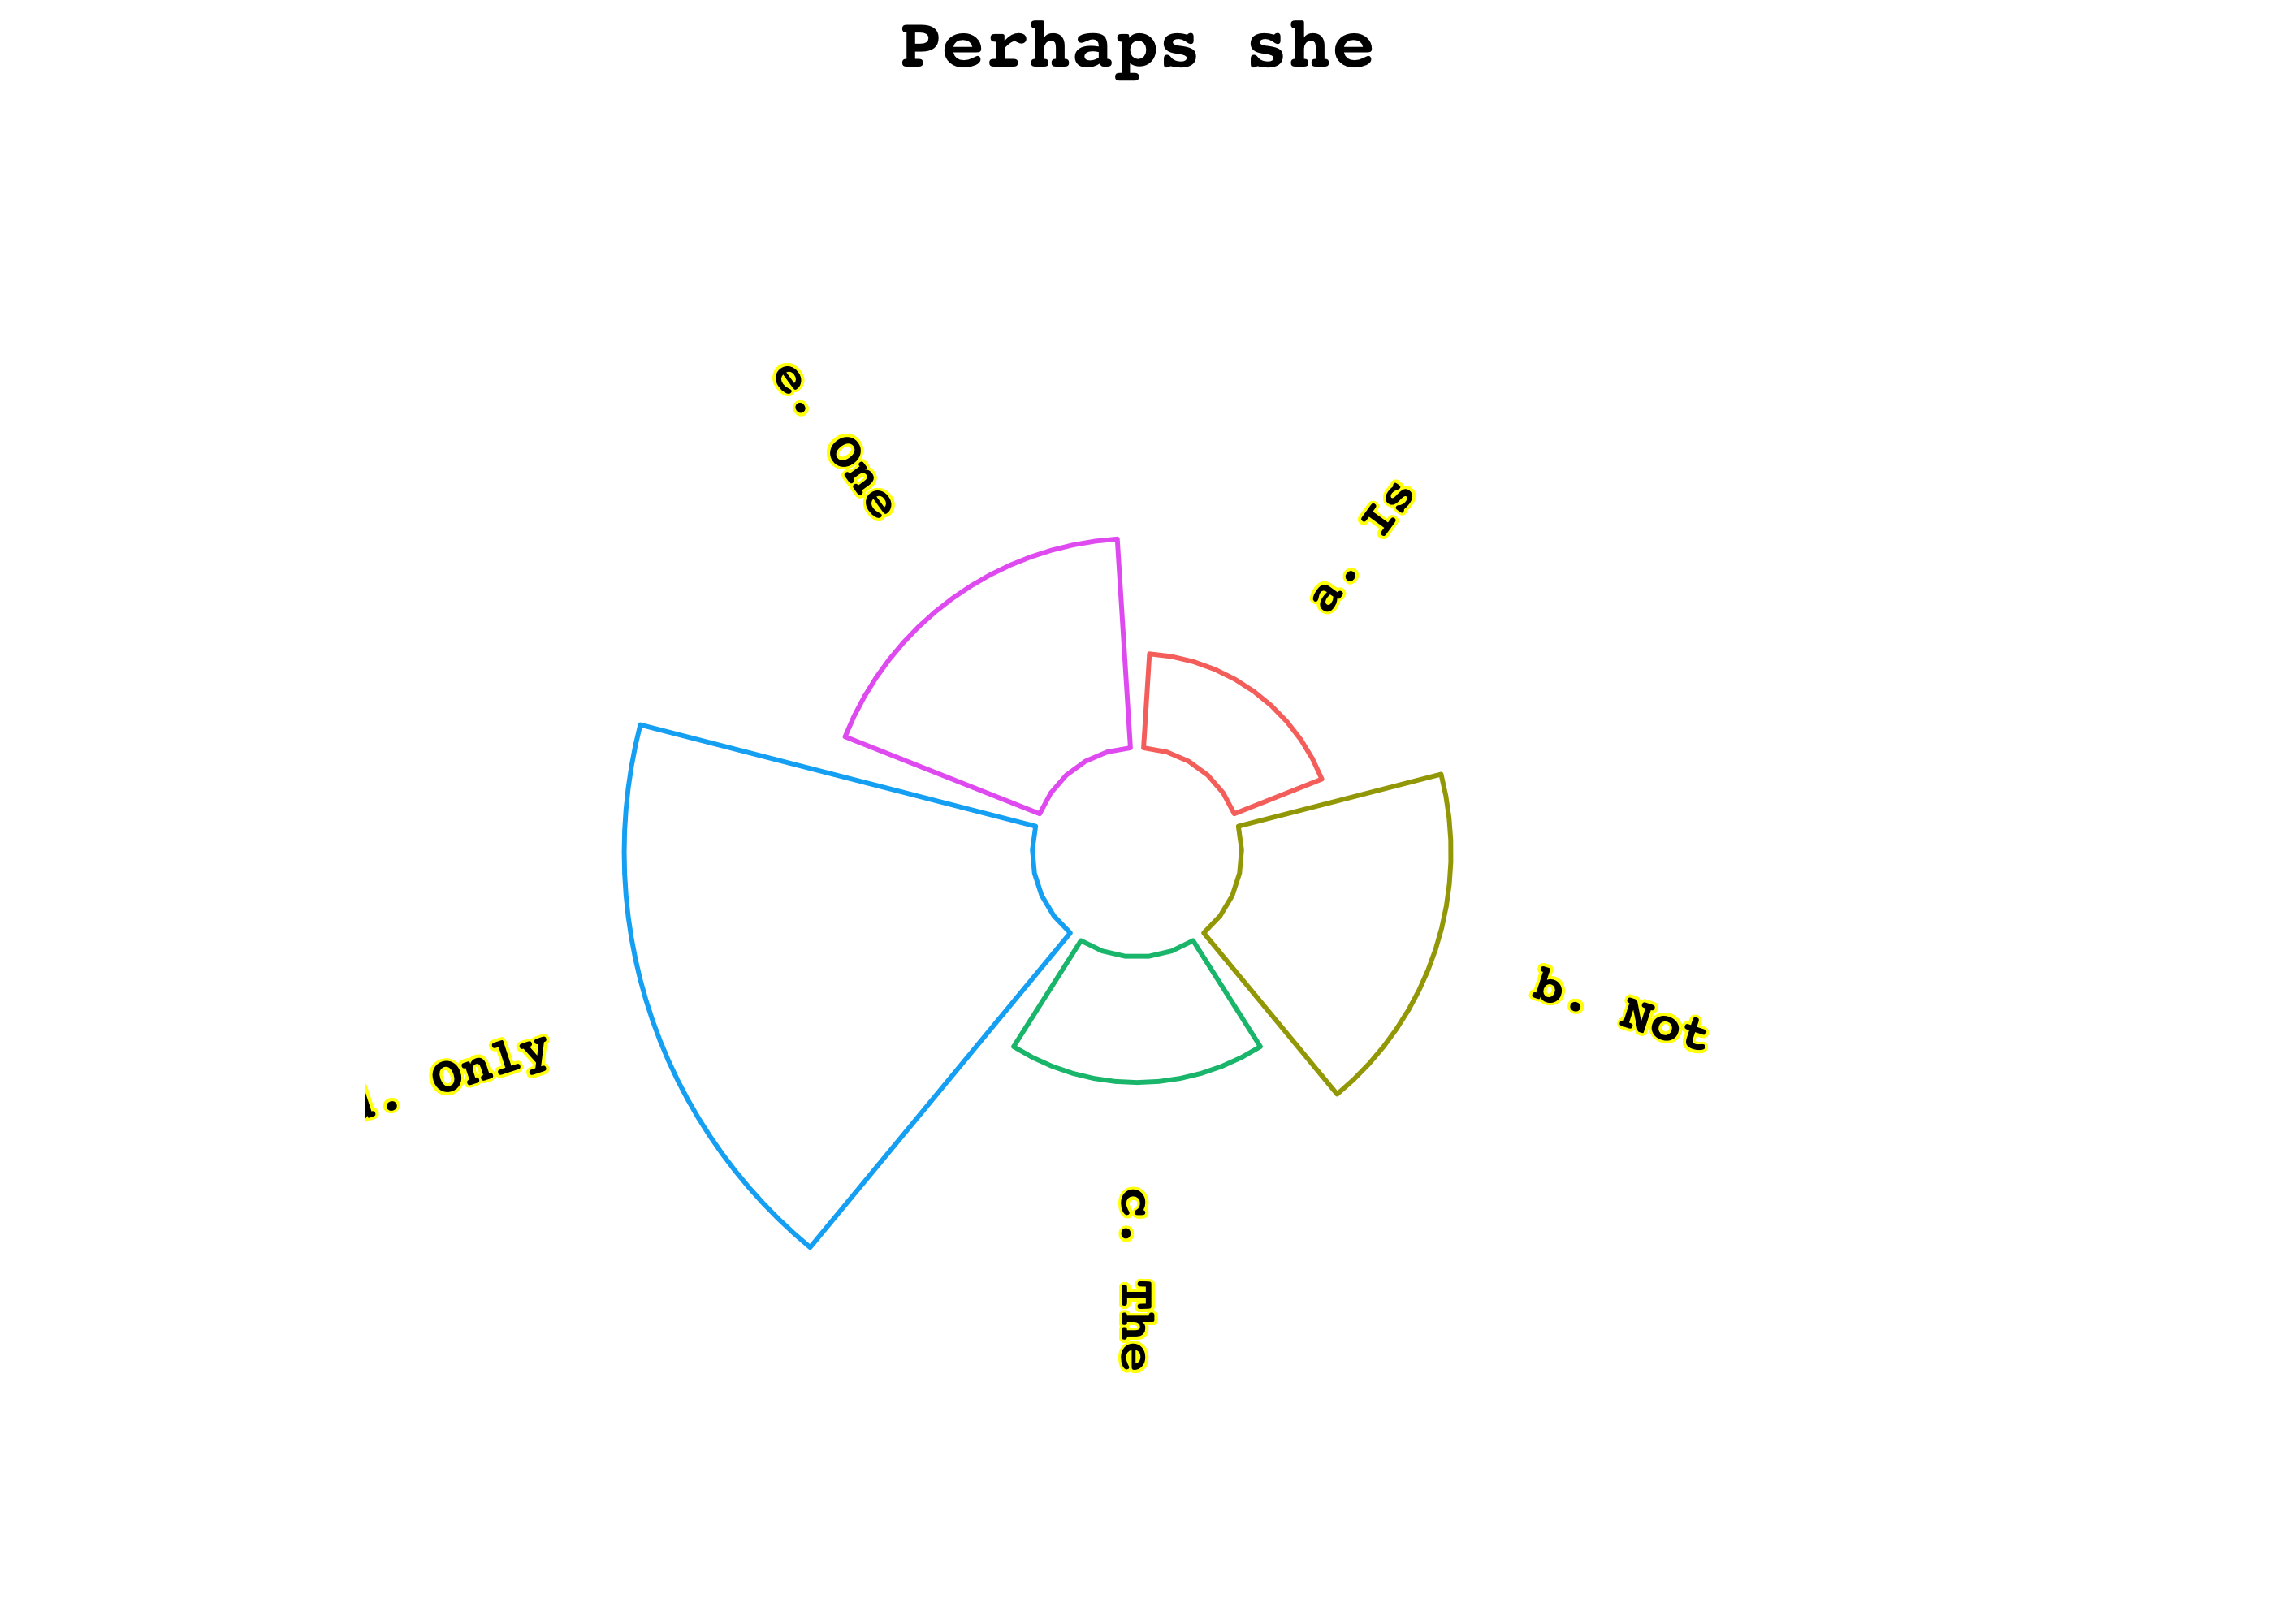
pie_bake_pro(data = example, template = "cirbar3", title = "Perhaps she")
Or, if you are interested in a circular packing chart, you can easily
do it with the bubble_blow function:
exblow <- data.frame(
  LETTERS[1:8],
  c(33, 24, 54, 12, 43, 88, 66, 78)
)
bubble_blow(exblow, template = "bub2", perc = "below", title = "Easy bubbles:")
#> Warning: Using `size` aesthetic for lines was deprecated in ggplot2 3.4.0.
#> ℹ Please use `linewidth` instead.
#> ℹ The deprecated feature was likely used in the tastypie package.
#>   Please report the issue at <https://github.com/PaoloDalena/tastypie/issues>.
#> This warning is displayed once every 8 hours.
#> Call `lifecycle::last_lifecycle_warnings()` to see where this warning was
#> generated.
Not sure which template to choose? Run
pie_discover() to find out a random
combination of templates, number of groups and features and get an idea
of the many available plots:
pie_discover()
Want to display an example of a particular template with particular
features? Try pie_templates():
pie_templates("eaten4", n_groups = 9)
Do you want a list of all the available templates? Check the
pie_template_list and the
pie_template_list_pro vectors!
pie_template_list # to be used with pie_bake()
#>  [1] "basic1"   "basic2"   "basic3"   "basic4"   "basic5"   "bw1"
#>  [7] "bw2"      "bw3"      "bw4"      "bw5"      "blue1"    "blue2"
#> [13] "blue3"    "blue4"    "blue5"    "red1"     "red2"     "red3"
#> [19] "red4"     "red5"     "rainbow1" "rainbow2" "rainbow3" "rainbow4"
#> [25] "rainbow5" "donut1"   "donut2"   "donut3"   "donut4"   "donut5"

pie_template_list_pro # to be used with pie_bake_pro()
#>  [1] "eaten1"      "eaten2"      "eaten3"      "eaten4"      "eaten5"
#>  [6] "dart1"       "dart2"       "dart3"       "dart4"       "dart5"
#> [11] "eye1"        "eye2"        "eye3"        "eye4"        "eye5"
#> [16] "watermelon1" "watermelon2" "watermelon3" "watermelon4" "watermelon5"
#> [21] "cirbar1"     "cirbar2"     "cirbar3"     "cirbar4"     "cirbar5"
#> [26] "spider1"     "spider2"     "spider3"     "spider4"     "spider5"
Do you want to see all possible templates displayed? Here you can find what you are looking for.
Do you want to add some images to your tasty pie chart? You can do it
easily with pie_addimages()! Check out an
example of how to do it here.
Be curious, there are many tasty pies!
If you need some more features, please tell me here.
If you encounter a bug, please file a reprex (minimal reproducible example) here.
These binaries (installable software) and packages are in development.
They may not be fully stable and should be used with caution. We make no claims about them.