The hardware and bandwidth for this mirror is donated by METANET, the Webhosting and Full Service-Cloud Provider.
If you wish to report a bug, or if you are interested in having us mirror your free-software or open-source project, please feel free to contact us at mirror[@]metanet.ch.
![]()
![]()
The goal of tidyspec is to provide a friendly pipeline for spectroscopy analysis using the tidy data philosophy.
You can install the development version of tidyspec from GitHub with:
# install.packages("devtools")
devtools::install_github("marceelrf/tidyspec")The tidyspec package was design to enable the data
analysis of spectroscopy data (as IR, Raman, NMR) with the tidy-data
format. There are 6 families of functions in tidyspec, all
starting with spec_:
Transformation: Convert data from absorbance to
transmittance (spec_abs2trans) & from transmittance to
absorbance (spec_trans2abs).
Normalize: Normalize the data to range 0-1
(spec_norm_01), normalize between a custom range
(spec_norm_minmax), or normalize to have a standard
deviation of one (spec_norm_var).
Baseline correction: Correct the baseline using
the the rolling ball algorithm
(spec_blc_rollingBall) or Iterative Restricted Least
Squares (spec_blc_irls). The function
spec_bl return the baseline vectors
(spec_bl_rollingBall, spec_bl_irls).
Smooth correction: Smooth the data using the
average window (spec_smooth_avg) or using the
Savitzky-Golay algorithm (spec_smooth_sga).
Derivative: Create differential data from the
spectra (spec_diff).
Preview: Preview your data while applying
changes statically (spec_smartplot) or interactively
(spec_smartplotly).
Import/Export: Import spectra data from common
data formats, like csv, txt, tsv, xslx and xls, with
spec_read. Export functions will be created in next moment,
but user can easily use {readr} or {writexl}
functions.
The function set_spec_wn simplifies the use of functions
by globally defining the column that contains the wave numbers. User can
check the wavenumber column with check_wn_col.
This is a basic example which shows you how to solve a common problem:
library(tidyspec)head(CoHAspec)
#> # A tibble: 6 x 5
#> Wavenumber CoHA01 CoHA025 CoHA05 CoHA100
#> <dbl> <dbl> <dbl> <dbl> <dbl>
#> 1 399. 0.871 1.36 1.17 1.05
#> 2 401. 0.893 1.24 1.05 0.925
#> 3 403. 0.910 1.20 0.997 0.876
#> 4 405. 0.914 1.19 0.982 0.867
#> 5 407. 0.908 1.18 0.965 0.857
#> 6 409. 0.887 1.14 0.936 0.828set_spec_wn("Wavenumber")
check_wn_col()
#> The current wavenumber column is: Wavenumberspec_smartplot(CoHAspec)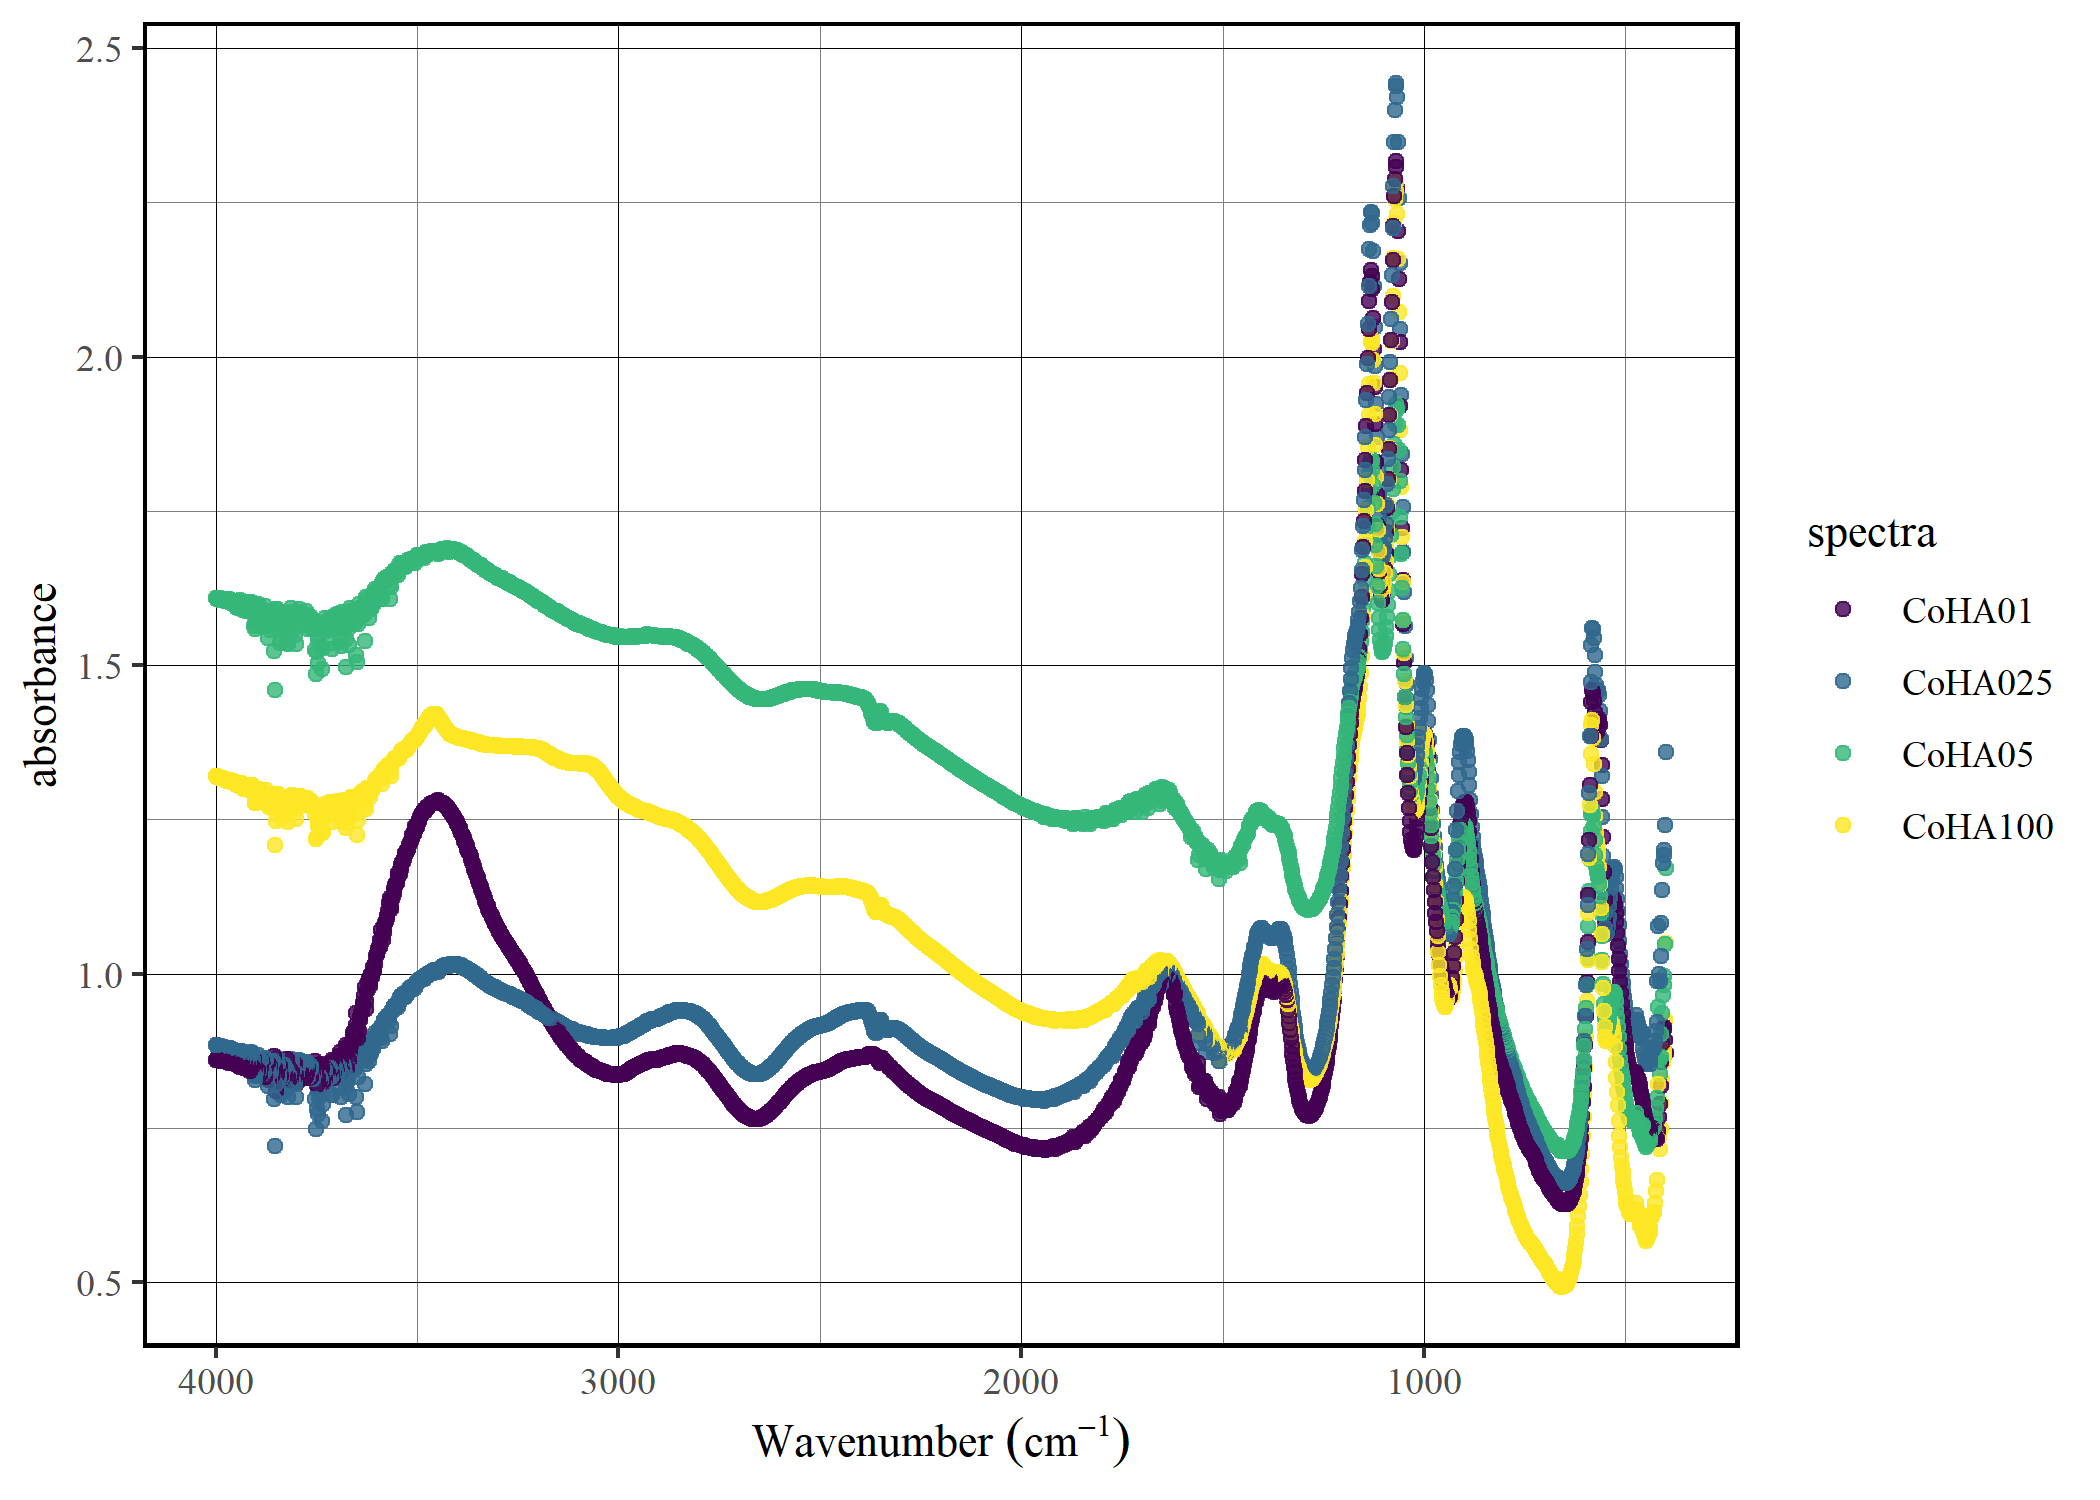
CoHAspec |>
    spec_abs2trans() |>
    spec_smartplot(type = "transmittance")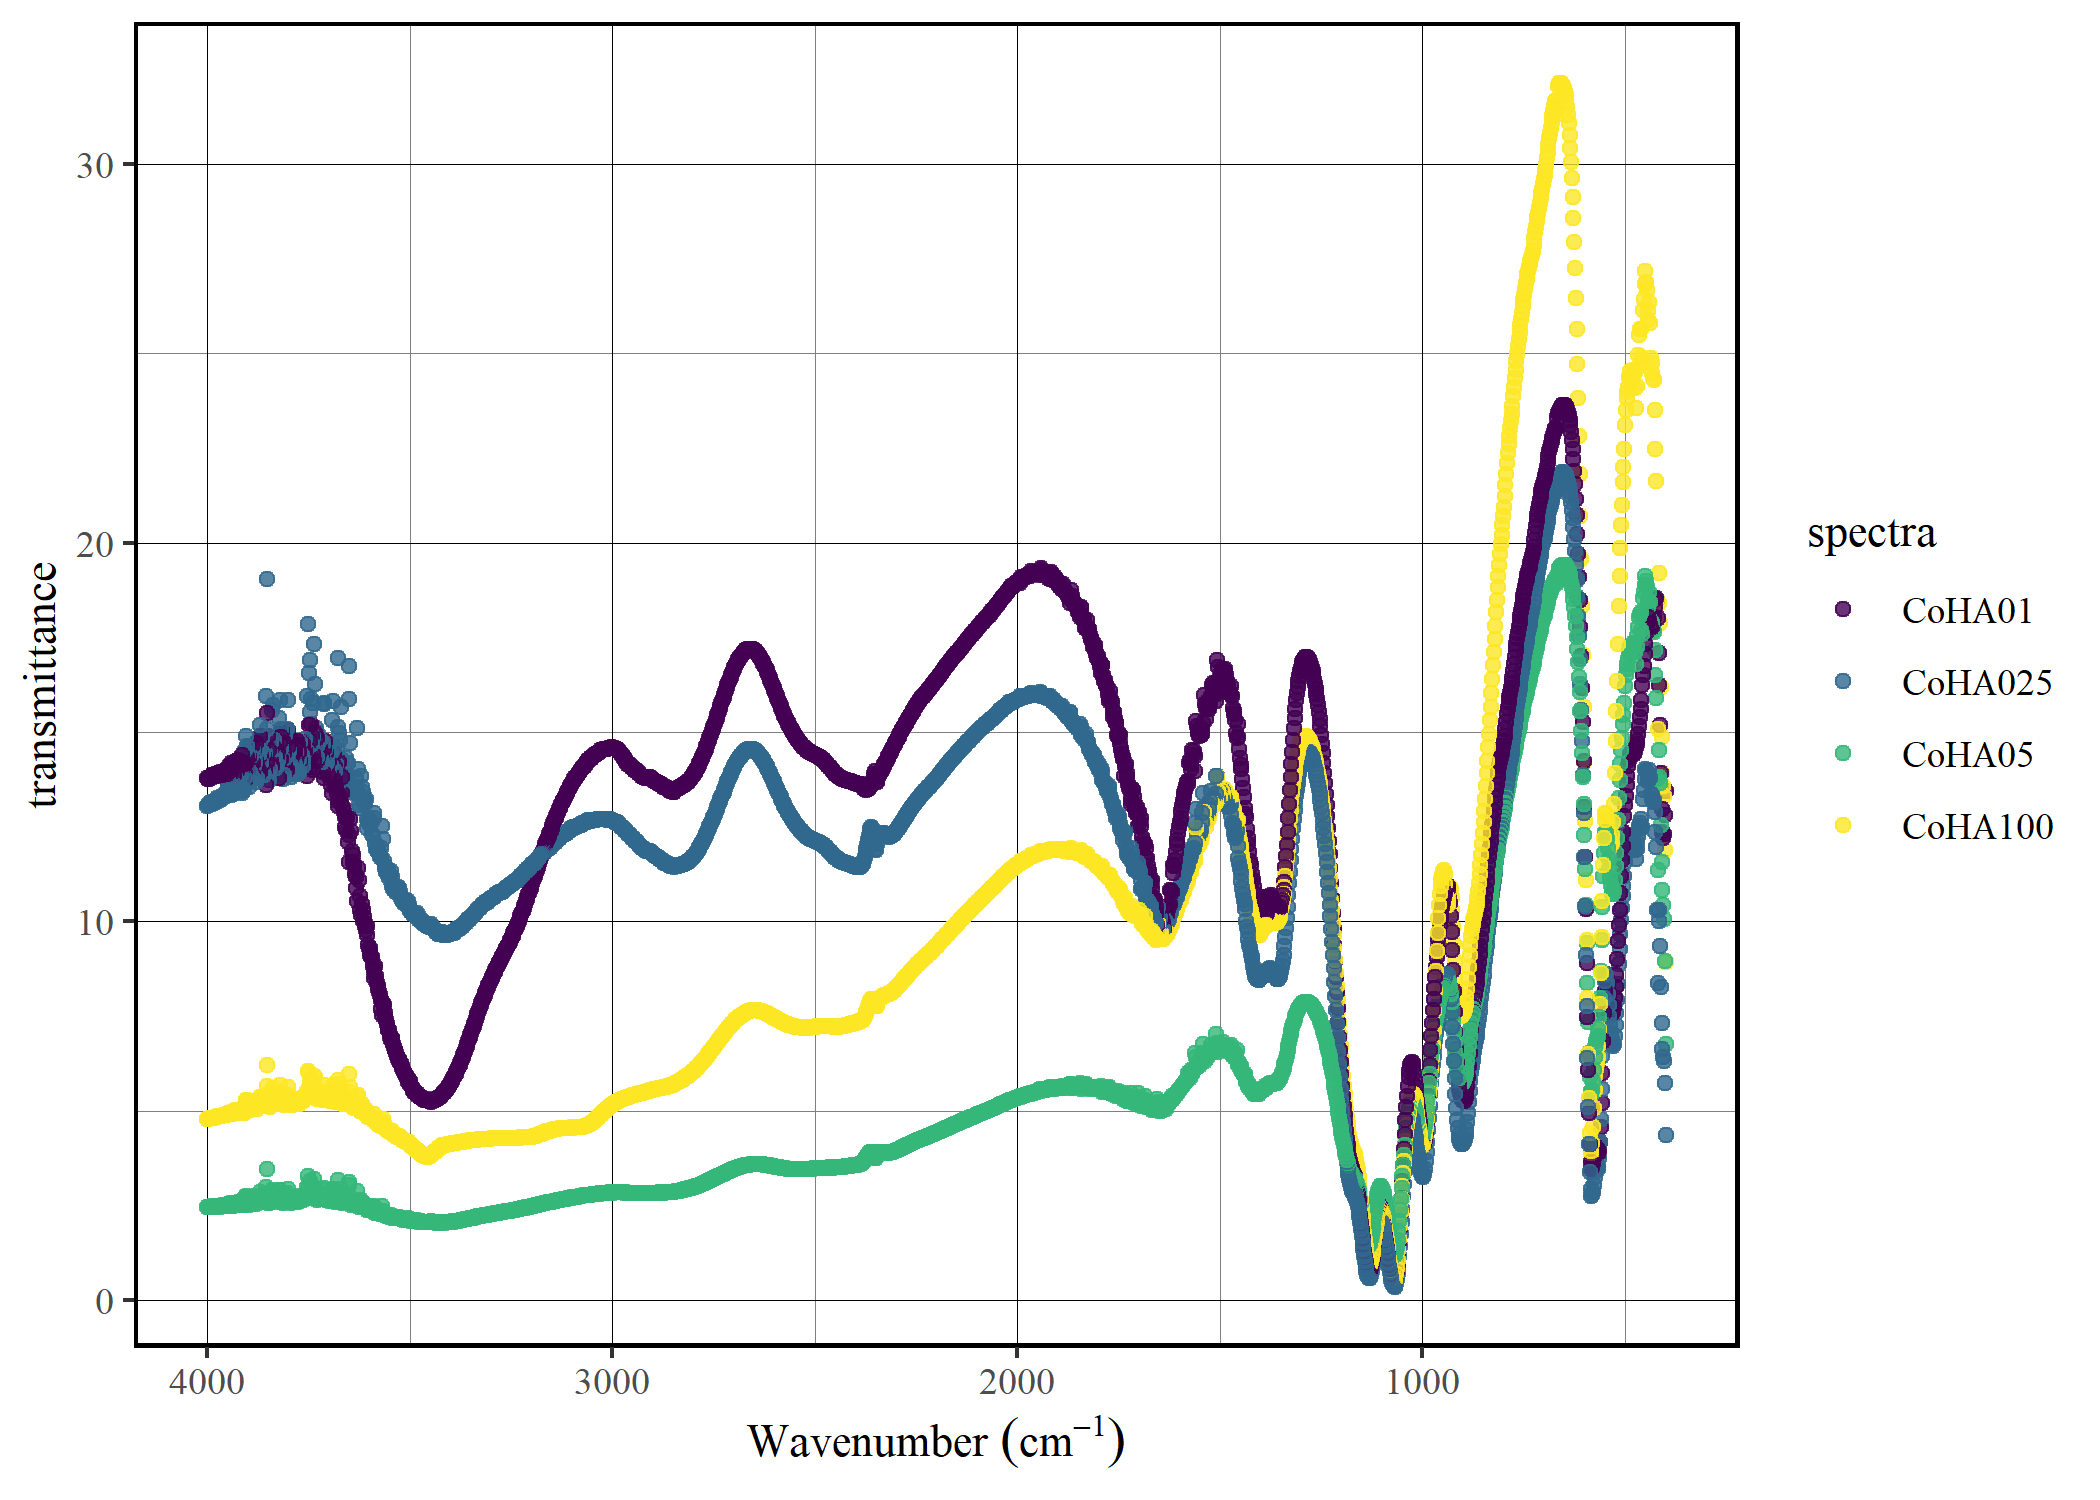
spec_select(CoHAspec, CoHA01) |>
  spec_smartplot(geom = "line")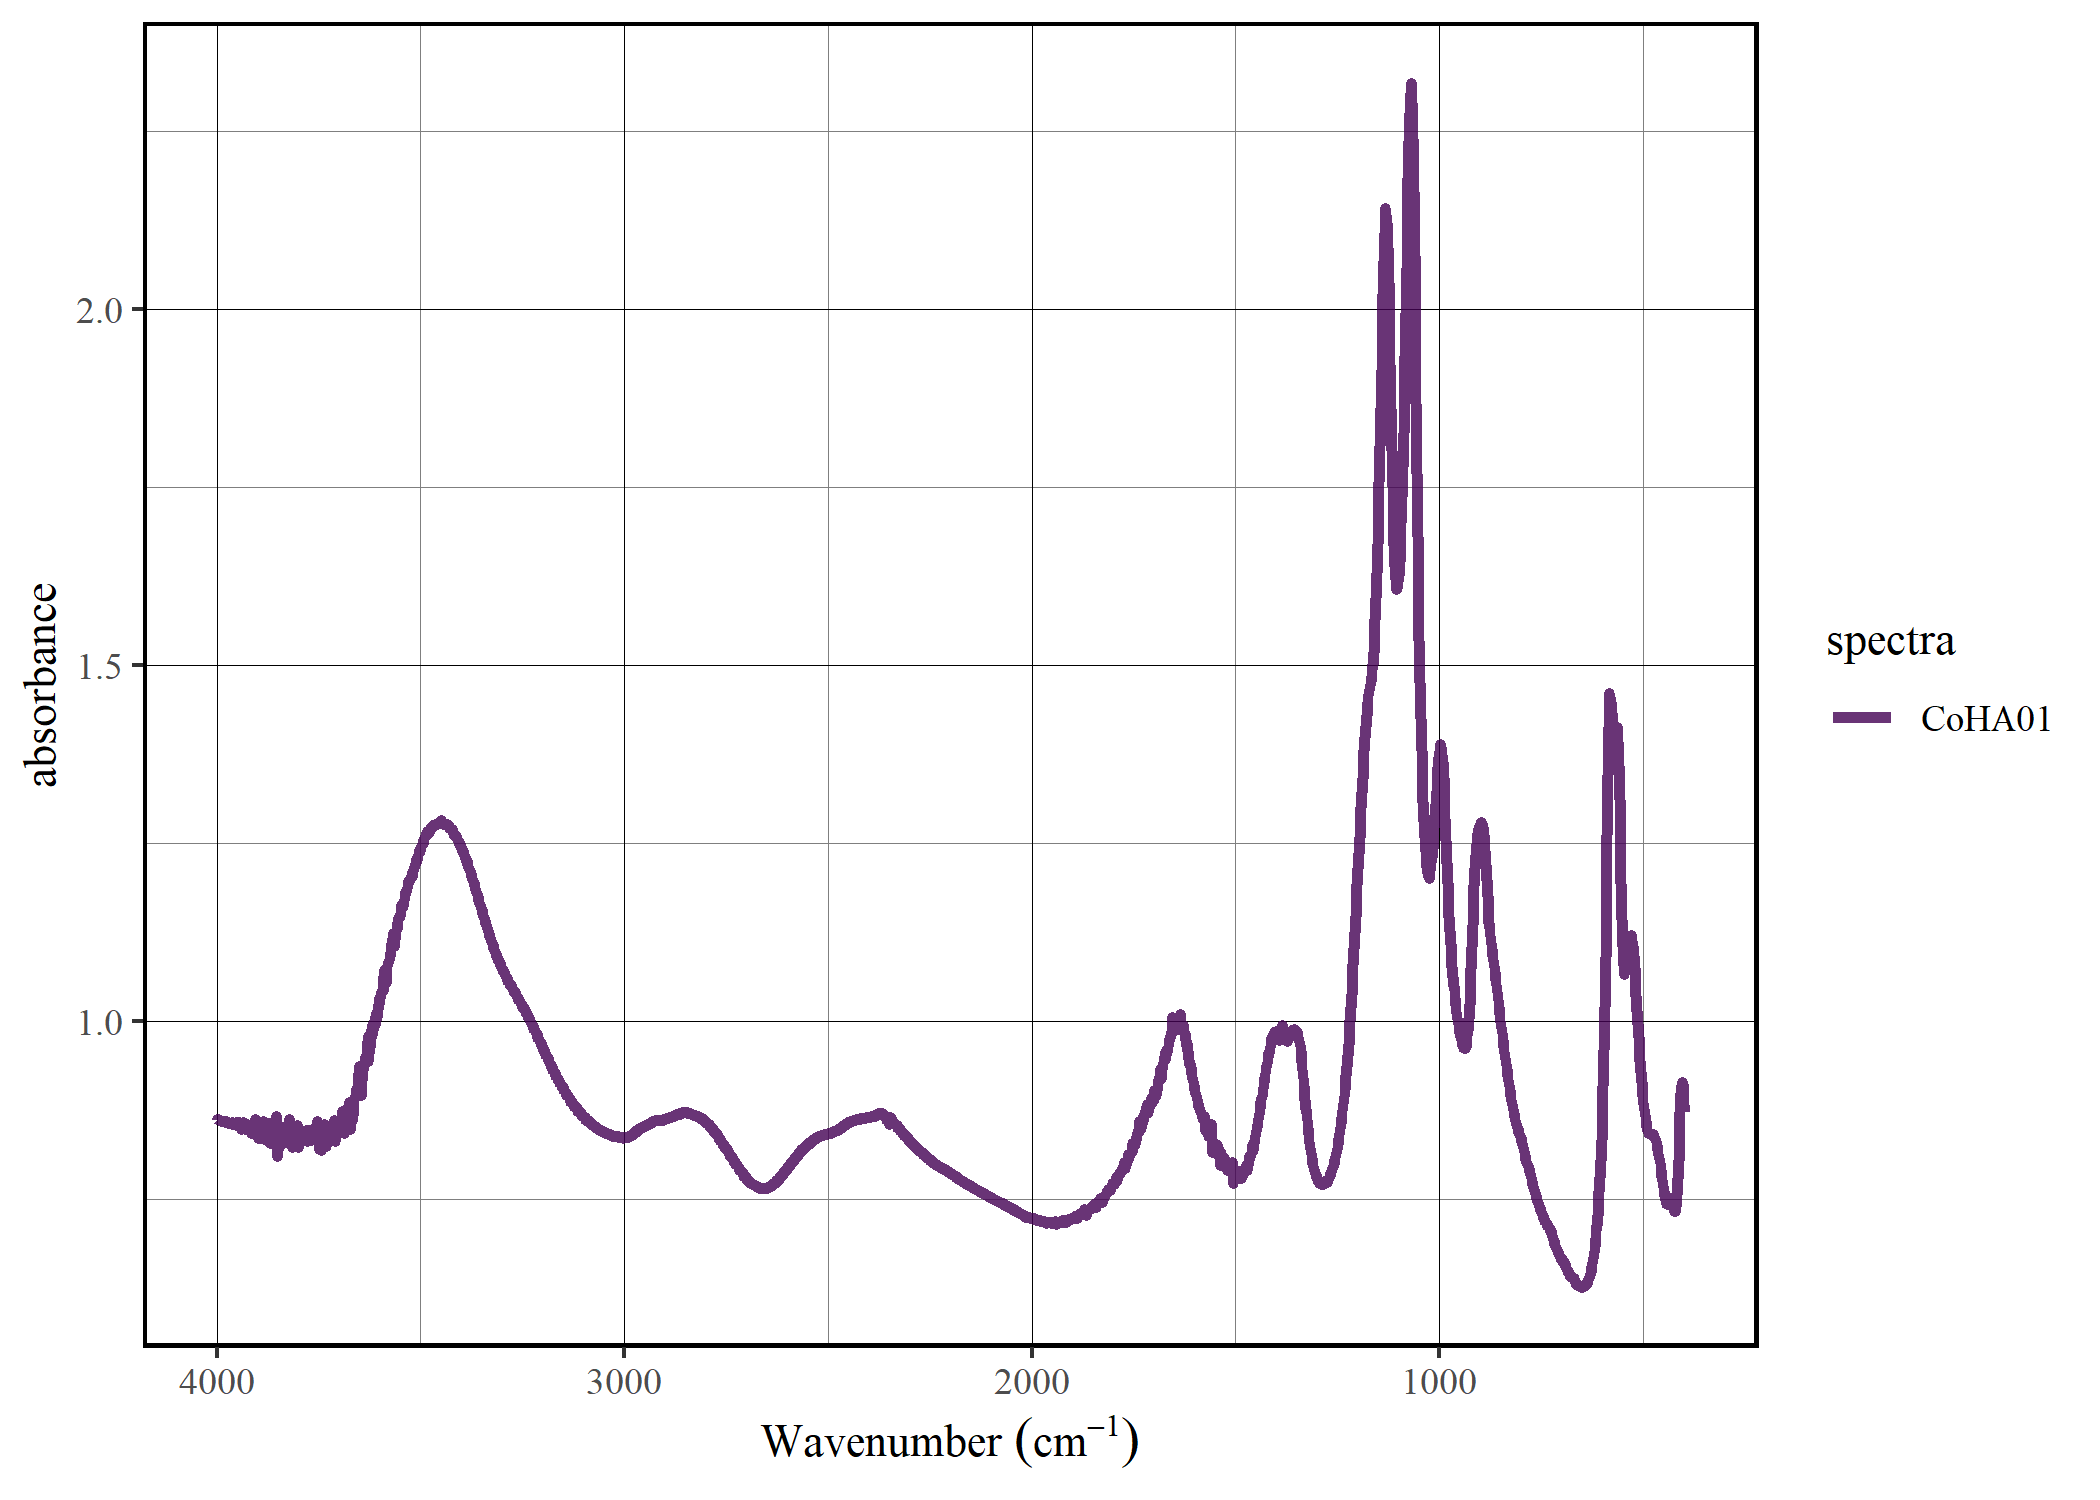
tidyspecOur plan is for tidyspec to be the first step toward a complete ecosystem for spectral data analysis. For spectral band analysis, we are creating the bandspec package that handles different band profiles. We also intend to create a package focused on producing publication-level graphics for spectral data. We haven’t thought of a name yet, so we welcome suggestions!
These binaries (installable software) and packages are in development.
They may not be fully stable and should be used with caution. We make no claims about them.