The hardware and bandwidth for this mirror is donated by METANET, the Webhosting and Full Service-Cloud Provider.
If you wish to report a bug, or if you are interested in having us mirror your free-software or open-source project, please feel free to contact us at mirror[@]metanet.ch.
![]()
![]()
The {trackopt} package tracks parameter values,
gradients, and Hessians at each iteration of numerical optimizers in
R. This can be useful for analyzing optimization progress,
diagnosing issues, and studying convergence behavior.
You can install the released package version from CRAN with:
install.packages("trackopt")The following example tracks nlm while it minimizes Himmelblau’s
function:
library("trackopt")
himmelblau <- function(x) (x[1]^2 + x[2] - 11)^2 + (x[1] + x[2]^2 - 7)^2
track <- nlm_track(f = himmelblau, p = c(0, 0))
summary(track)
#> Iterations: 16
#> Function improvement: 170 -> 1.521e-07
#> Computation time: 0.07373 seconds
#> Initial parameter: 0, 0
#> Final parameter: 3, 2
ggplot2::autoplot(track)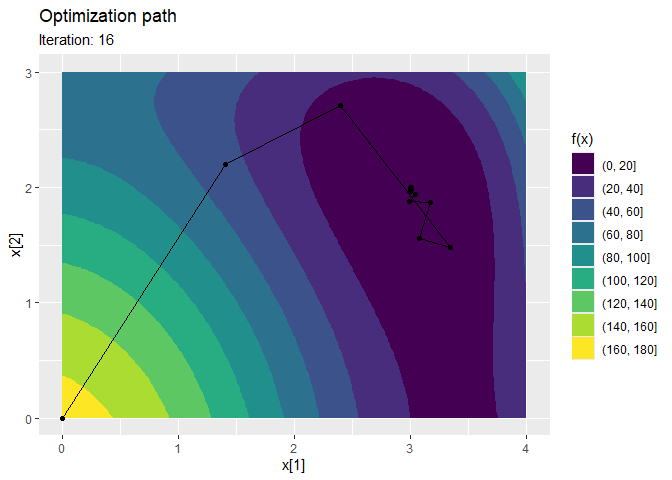
The next example tracks optim while it minimizes a
quartic polynomial:
polynomial <- function(x) 5 * x^4 + 4 * x^3 + x^2 + 3 * x + 2
gradient <- function(x) 20 * x^3 + 12 * x^2 + 2 * x + 3
track <- optim_track(
  f = polynomial,
  p = 0,
  gradient = gradient,
  method = "BFGS"
)
print(track)
#> # A tibble: 9 × 6
#>   iteration value         step parameter hessian seconds
#> *     <dbl> <dbl>        <dbl>     <dbl>   <dbl>   <dbl>
#> 1         0 2      0               0       NA    0
#> 2         1 0.344 -1.66           -0.6      9.20 0.00830
#> 3         2 0.241 -0.103          -0.672   13.0  0.00156
#> 4         3 0.212 -0.0293         -0.712   15.3  0.00144
#> 5         4 0.207 -0.00524        -0.730   16.4  0.00144
#> 6         5 0.206 -0.000679       -0.736   16.8  0.00143
#> 7         6 0.206 -0.0000752      -0.738   17.0  0.00271
#> 8         7 0.206 -0.00000784     -0.739   17.0  0.00151
#> 9         8 0.206 -0.000000802    -0.739   17.0  0.00147
ggplot2::autoplot(track)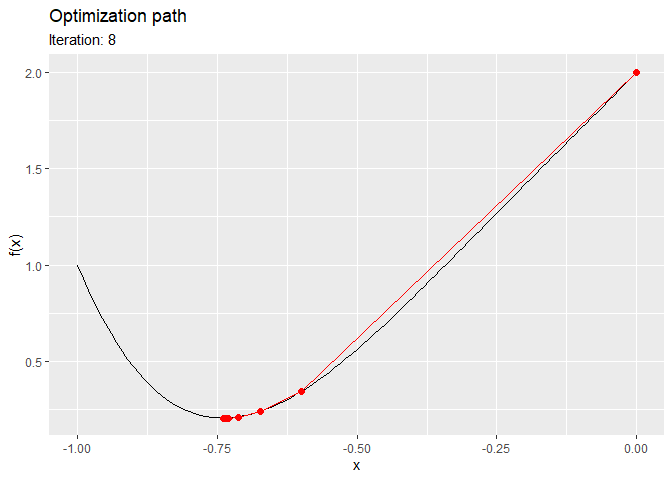
If you have questions, find a bug, or need a feature, please file an issue on GitHub.
These binaries (installable software) and packages are in development.
They may not be fully stable and should be used with caution. We make no claims about them.