The hardware and bandwidth for this mirror is donated by METANET, the Webhosting and Full Service-Cloud Provider.
If you wish to report a bug, or if you are interested in having us mirror your free-software or open-source project, please feel free to contact us at mirror[@]metanet.ch.
![]()
![]()
![]()
The goal of unusualprofile is to calculate conditional Mahalanobis distances and related statistics. Such statistics can help find cases that are unusual, even after controlling for specified predictors.
You can install the development version from GitHub with:
# install.packages("remotes")
remotes::install_github("wjschne/unusualprofile")To use the unusualprofile package, one needs to know the correlations, means, and standard deviations among a set of continuous variables and at least one row of data from that set of variables.
Suppose we have set of variables that have the following relationships:

First, we load the unusualprofile package.
library(unusualprofile)Included with the unusualprofile package, the d_example
data set has a single row of data generated from the path diagram
depicted above.
#>        X_1     X_2      X_3      Y_1        Y_2      Y_3        X        Y
#> 1 1.999498 1.44683 2.703249 1.664106 -0.8427126 1.811528 2.273441 1.201208
Also included with the unusualprofile package is the path diagram’s model-implied correlation matrix:
R_example
#>       X_1  X_2   X_3   Y_1   Y_2   Y_3    X    Y
#> X_1 1.000 0.35 0.560 0.336 0.294 0.378 0.70 0.42
#> X_2 0.350 1.00 0.400 0.240 0.210 0.270 0.50 0.30
#> X_3 0.560 0.40 1.000 0.384 0.336 0.432 0.80 0.48
#> Y_1 0.336 0.24 0.384 1.000 0.560 0.720 0.48 0.80
#> Y_2 0.294 0.21 0.336 0.560 1.000 0.630 0.42 0.70
#> Y_3 0.378 0.27 0.432 0.720 0.630 1.000 0.54 0.90
#> X   0.700 0.50 0.800 0.480 0.420 0.540 1.00 0.60
#> Y 0.420 0.30 0.480 0.800 0.700 0.900 0.60 1.00cond_maha
functionWe can specify the correlations (R), means
(mu), standard deviations (sigma). independent
variables (v_ind), and dependent variables
(v_dep). In this case, the independent variables are
composite scores summarizing the dependent variables.
# Conditional Mahalanobis distance
cm <- cond_maha(data = d_example,
          R = R_example,
          mu = 0,
          sigma = 1,
          v_ind_composites = c("X", "Y"),
          v_dep = c("X_1", "X_2", "X_3",
                    "Y_1", "Y_2", "Y_3"))

cm
#> Conditional Mahalanobis Distance = 3.5167, df = 4, p = 0.9852

# Plot
plot(cm)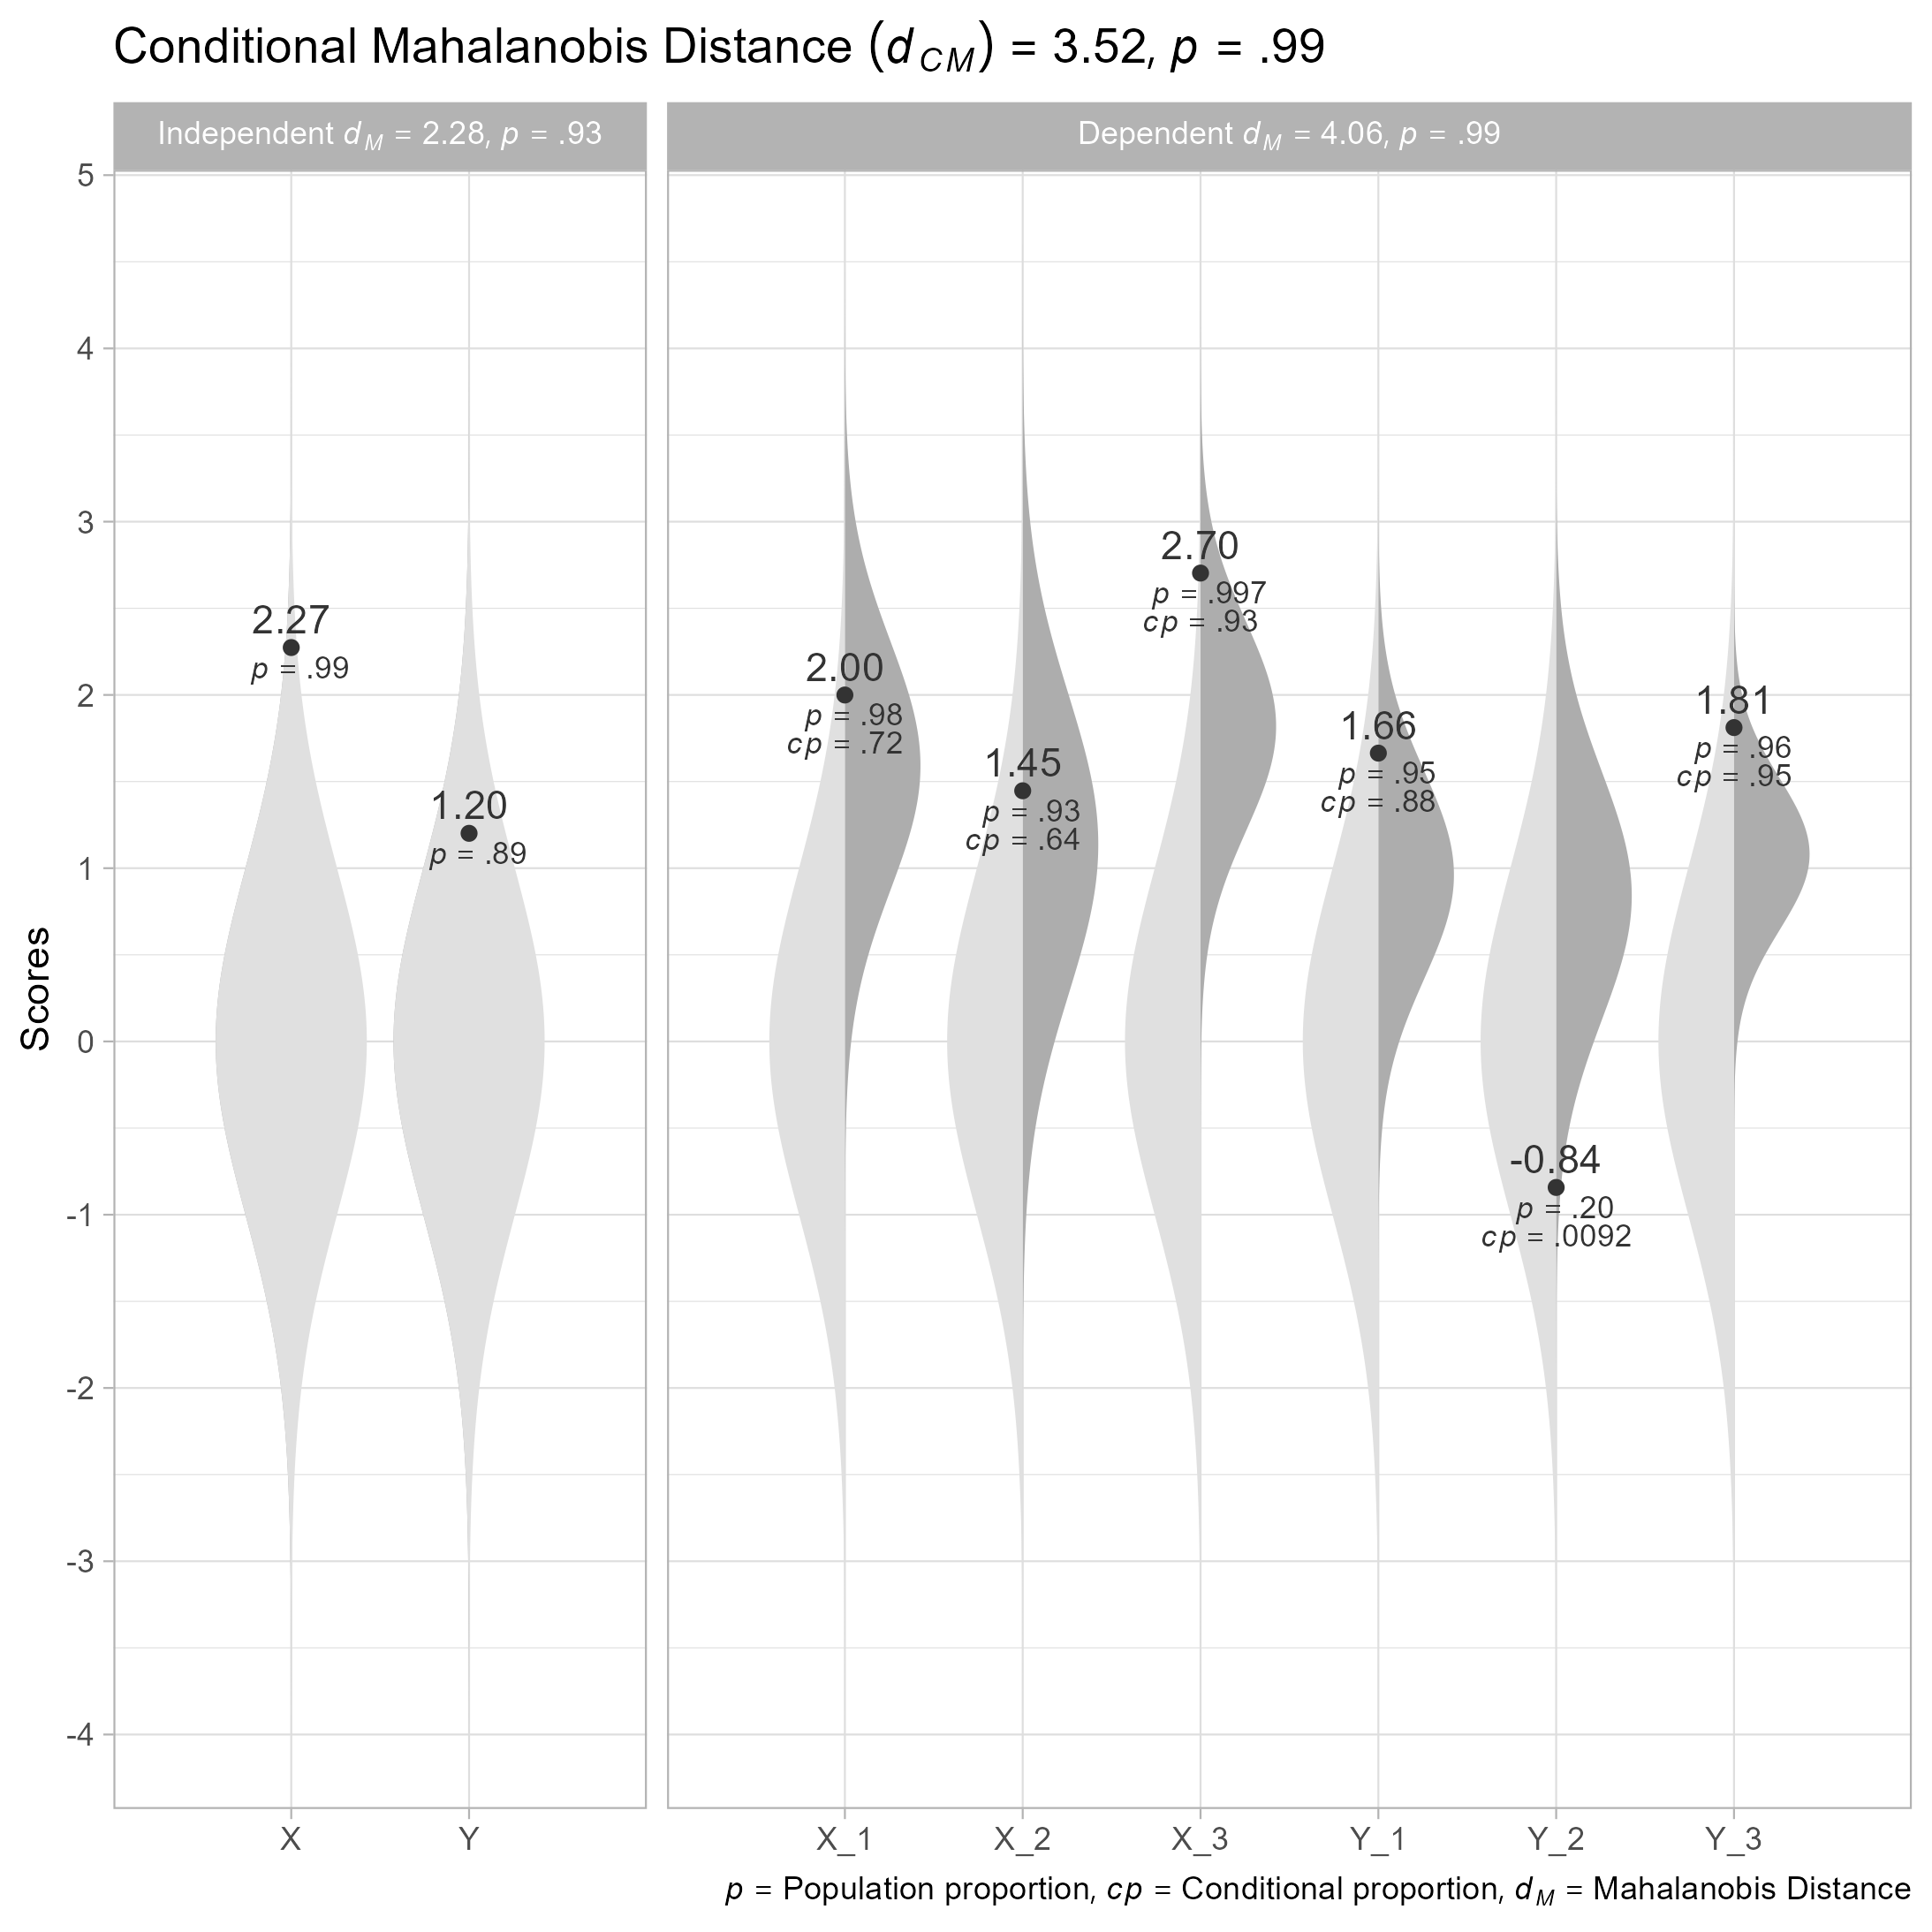
A user-friendly app that performs the functions of the unusualprofile package is here.
An introduction to the applications of conditional distributions and Mahalanobis distances:
Schneider, W. J., & Ji, F. (2023). Detecting unusual score patterns in the context of relevant predictors. Journal of Pediatric Neuropsychology, 9, 1–17. https://doi.org/10.1007/s40817-022-00137-x
These binaries (installable software) and packages are in development.
They may not be fully stable and should be used with caution. We make no claims about them.