The hardware and bandwidth for this mirror is donated by METANET, the Webhosting and Full Service-Cloud Provider.
If you wish to report a bug, or if you are interested in having us mirror your free-software or open-source project, please feel free to contact us at mirror[@]metanet.ch.
This is an R package to analyze system performance data with the Universal Scalability Law.
The Universal Scalability Law (USL) was developed by Dr. Neil J. Gunther. It can be used to analyze system performance data in order to learn more about the scalability limitations of the system.
Details are presented in the book Guerrilla Capacity Planning (doi:10.1007/978-3-540-31010-5) and on the authors website.
Here is an example for the scalability analysis of a Sun SPARCcenter 2000 in the SPEC SDM 91 benchmark. The data used is available for download from the SPEC website and also included as a demo dataset.
library(usl)

# Load data from the SPEC SDM91 benchmark
data(specsdm91)

specsdm91

# Analyze "throughput" by "load" for the "specsdm91" data
usl.model <- usl(throughput ~ load, specsdm91)

# Show a model summary including scalability coefficients
summary(usl.model)

# Predict the location of the maximum in the scalability function
peak.scalability(usl.model)

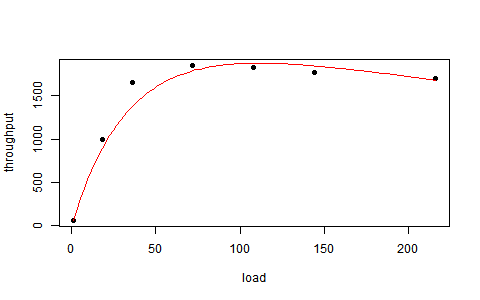
# Plot original data and computed scalability function
plot(specsdm91, pch=16)
plot(usl.model, col="red", add=TRUE)
The summary command returns the following output:
Call:
usl(formula = throughput ~ load, data = specsdm91)

Efficiency:
   Min     1Q Median     3Q    Max
0.0876 0.1626 0.2860 0.5624 0.7211

Residuals:
   Min     1Q Median     3Q    Max
 -81.7  -48.3  -25.1   29.5  111.1

Coefficients:
         Estimate  Std. Error  t value  Pr(>|t|)
alpha   0.0277285   0.0091217     3.04    0.0384  *
beta    0.0001044   0.0000199     5.25    0.0063  **
gamma  89.9952330  14.2134894     6.33    0.0032  **
---
Signif. codes:  0 ‘***’ 0.001 ‘**’ 0.01 ‘*’ 0.05 ‘.’ 0.1 ‘ ’ 1

Residual standard error: 82.8 on 4 degrees of freedom

Scalability bounds:
limit: throughput 3246 (Amdahl's asymptote)
peak:  throughput 1884 at load 96.52
opt:   throughput 1542 at load 36.06
The following image shows the plotted output:

The package is available from CRAN. Use the following command to install the package from the repository:
install.packages("usl")In addition to the package documentation there is also a package vignette available. Install the package and use the following command to open the vignette:
vignette("usl")The vignette is also available from CRAN: https://CRAN.R-project.org/package=usl/vignettes/usl.pdf
These binaries (installable software) and packages are in development.
They may not be fully stable and should be used with caution. We make no claims about them.