


The hardware and bandwidth for this mirror is donated by METANET, the Webhosting and Full Service-Cloud Provider.
If you wish to report a bug, or if you are interested in having us mirror your free-software or open-source project, please feel free to contact us at mirror[@]metanet.ch.
![]()
visreg is an R package for displaying the results of
a fitted model in terms of how a predictor variable x
affects an outcome y. The implementation of
visreg takes advantage of object-oriented programming
in R, meaning that it works with virtually any type of formula-based
model in R provided that the model class provides a
predict() method: lm, glm,
gam, rlm, nlme,
lmer, coxph, svm,
randomForest and many more.
To install the latest release version from CRAN:
install.packages("visreg")To install the latest development version from GitHub:
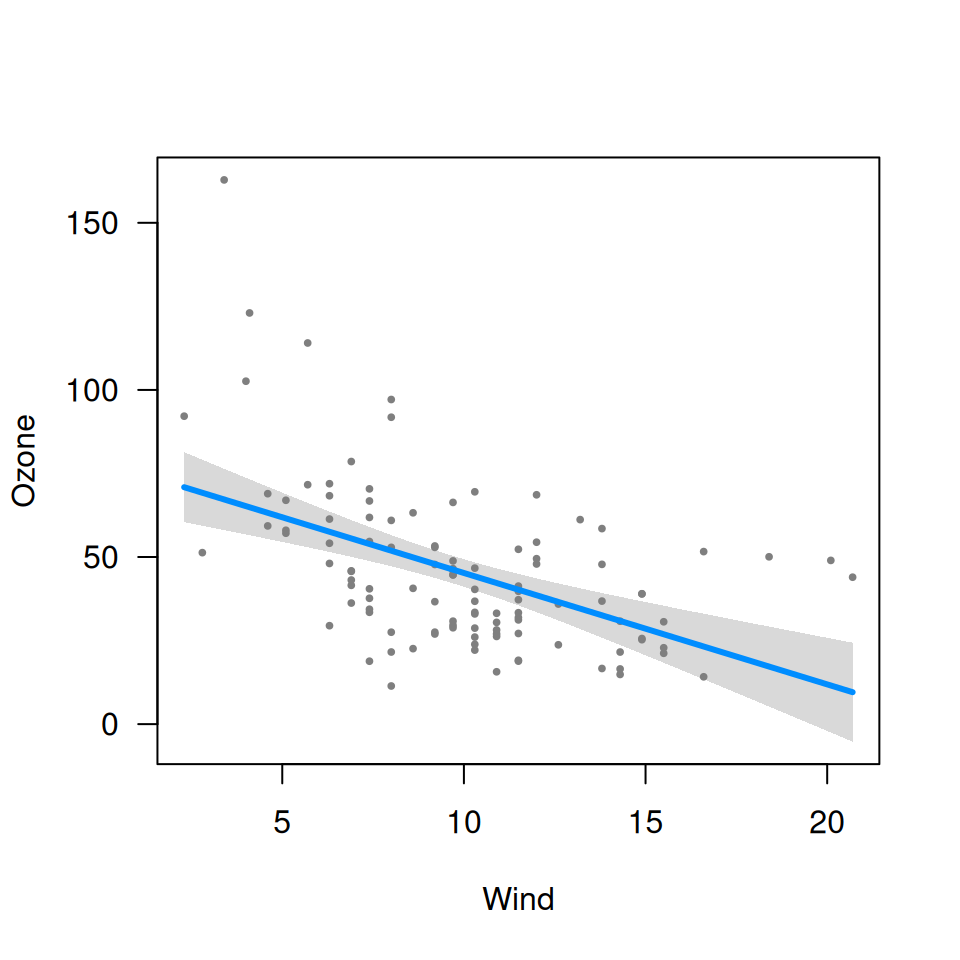
remotes::install_github("pbreheny/visreg")The basic usage is that you fit a model, for example:
fit <- lm(Ozone ~ Solar.R + Wind + Temp, data=airquality)and then you pass it to visreg:
visreg(fit, "Wind")
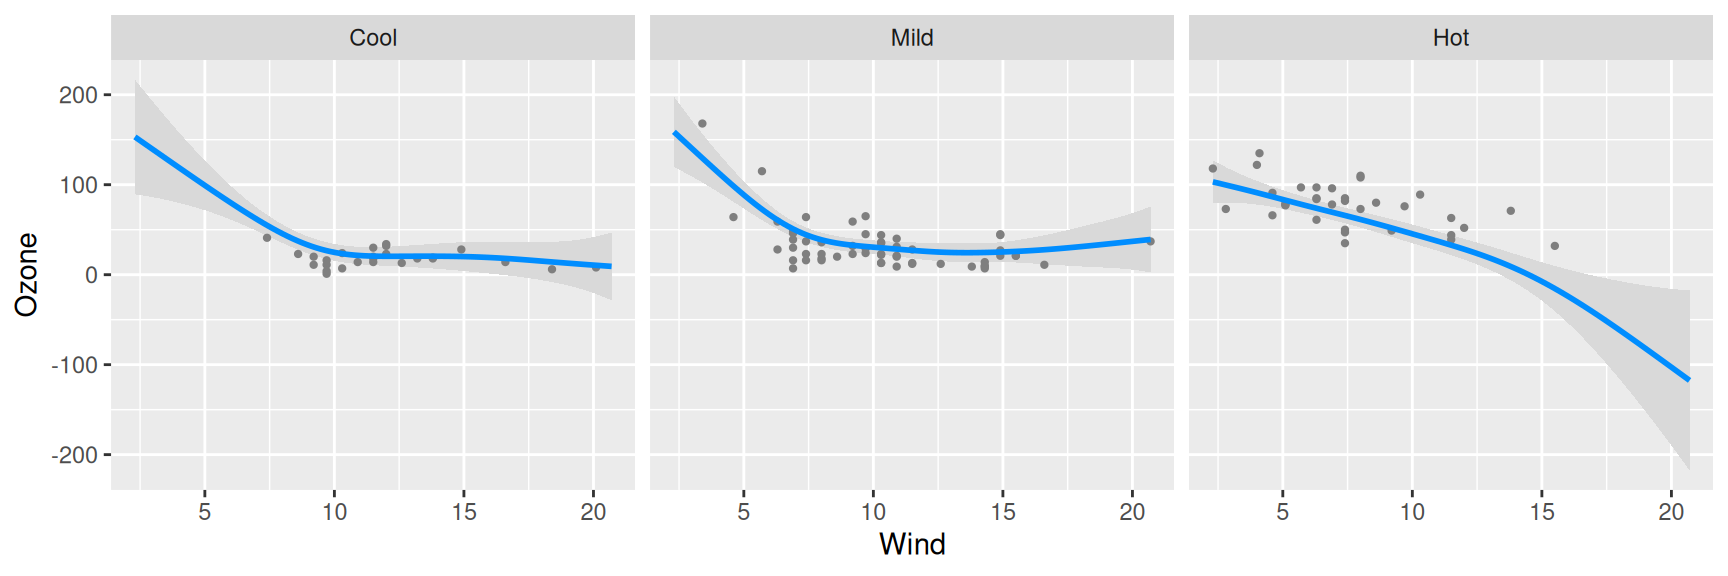
A more complex example, which uses the gam() function
from mgcv:
airquality$Heat <- cut(airquality$Temp, 3, labels=c("Cool", "Mild", "Hot"))
fit <- gam(Ozone ~ s(Wind, by=Heat, sp=0.1), data=airquality)
visreg(fit, "Wind", "Heat", gg=TRUE, ylab="Ozone")
For more information on visreg syntax and how to use it, see:
The website focuses more on syntax, options, and user interface, while the paper goes into more depth regarding the statistical details.
These binaries (installable software) and packages are in development.
They may not be fully stable and should be used with caution. We make no claims about them.