
The hardware and bandwidth for this mirror is donated by METANET, the Webhosting and Full Service-Cloud Provider.
If you wish to report a bug, or if you are interested in having us mirror your free-software or open-source project, please feel free to contact us at mirror[@]metanet.ch.
Visualize probability distributions


vistributions visualizes the normal, t, F, chi-square
and binomial distributions with ggplot2. Each family
exposes the same grammar: _plot for the shape,
_perc for quantiles from probabilities and
_prob for probabilities from quantiles, with shaded tails
and annotated cutoffs for teaching and publication.
# Install release version from CRAN
install.packages("vistributions")

# Install development version from GitHub
# install.packages("devtools")
devtools::install_github("rsquaredacademy/vistributions")| Family | Shape | Quantile from p | Probability from q |
|---|---|---|---|
| Normal | vdist_normal_plot() |
vdist_normal_perc() |
vdist_normal_prob() |
| t | vdist_t_plot() |
vdist_t_perc() |
vdist_t_prob() |
| F | vdist_f_plot() |
vdist_f_perc() |
vdist_f_prob() |
| Chi-square | vdist_chisquare_plot() |
vdist_chisquare_perc() |
vdist_chisquare_prob() |
| Binomial | vdist_binom_plot() |
vdist_binom_perc() |
vdist_binom_prob() |
All plotting functions print by default and return the
ggplot object invisibly. Pass
print_plot = FALSE to get a composable plot object for
further customization with + labs(),
+ theme_minimal() or ggplot2::ggsave().
# distribution shape
vdist_normal_plot()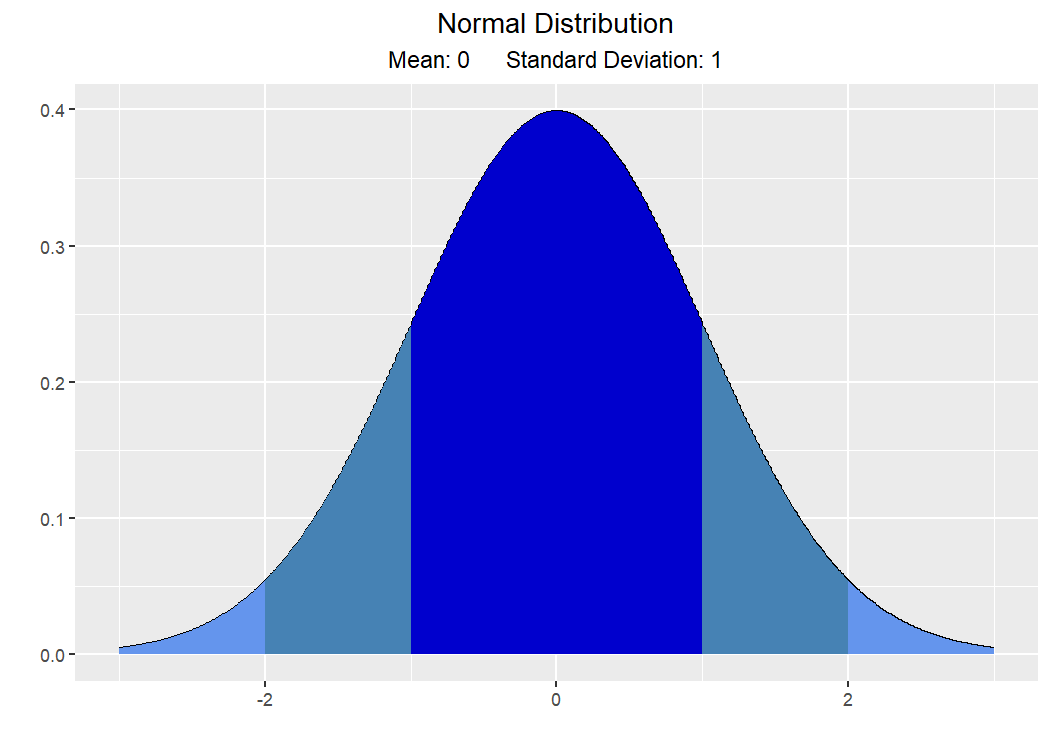
# quantile from a probability (upper 10%)
vdist_normal_perc(0.10, mean = 60, sd = 3, type = "upper")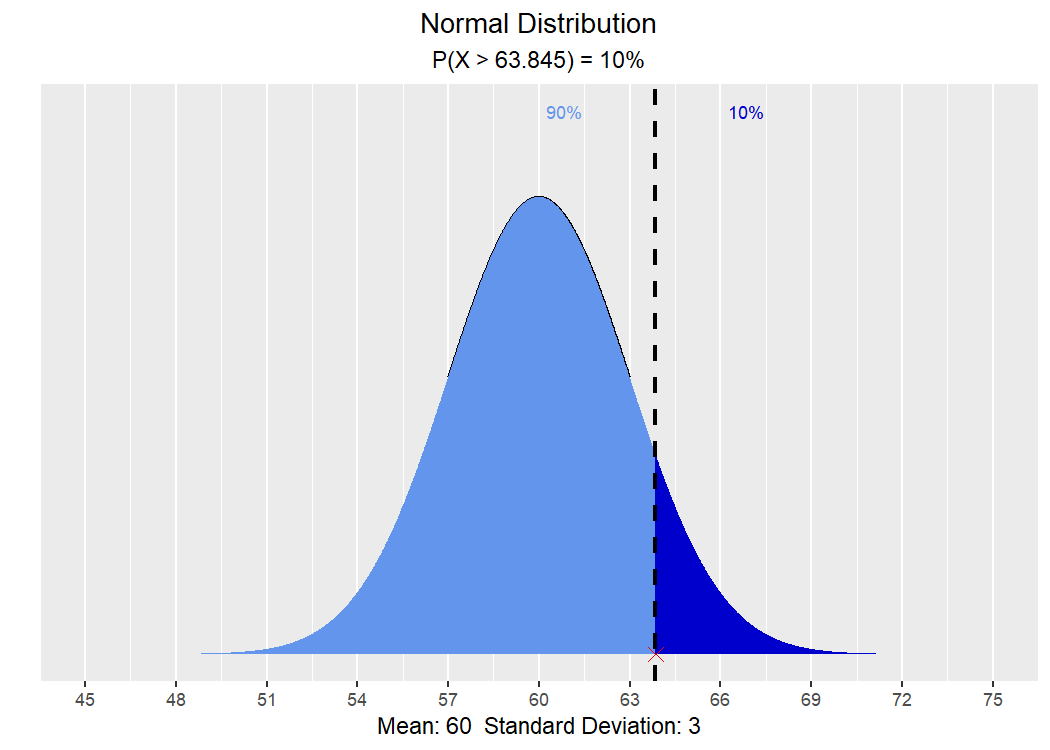
# probability from quantiles (middle 50%)
vdist_normal_prob(c(85, 100), mean = 90, sd = 4, type = "both")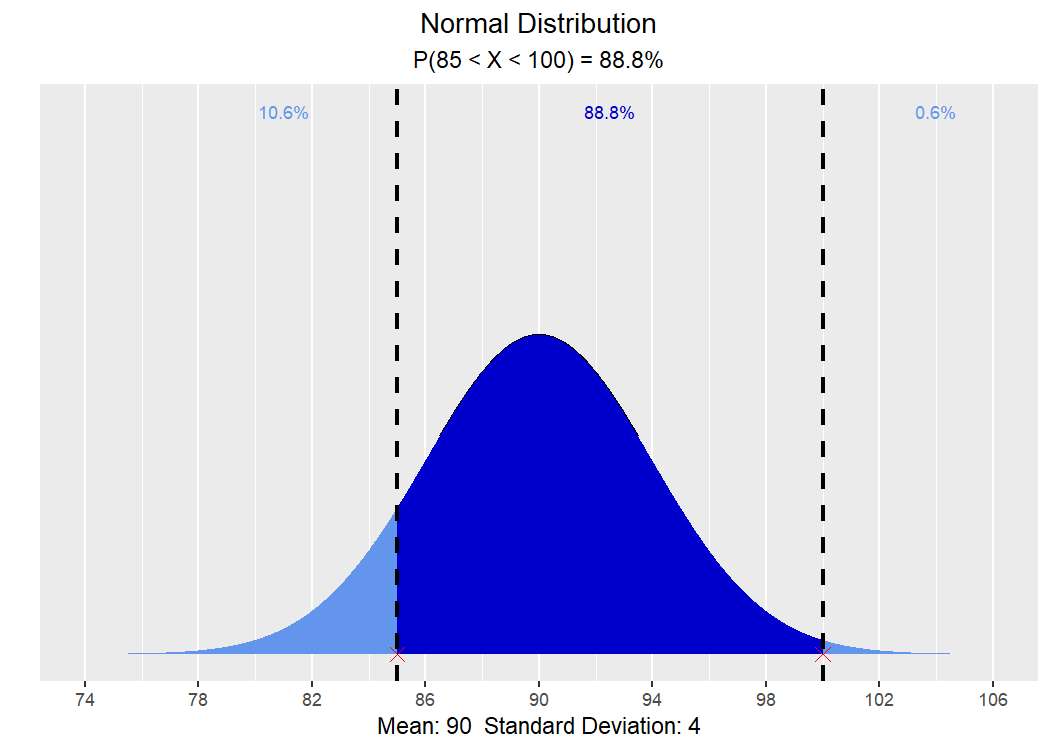
vdist_t_plot(df = 8)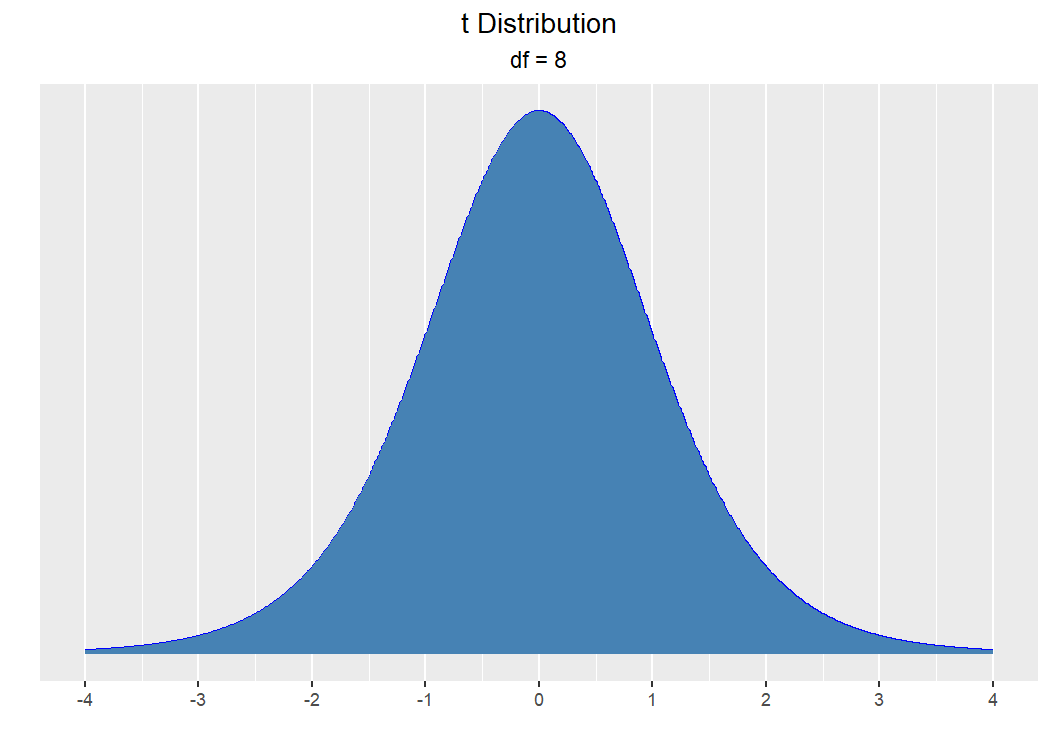
# upper 15th percentile
vdist_t_perc(0.15, df = 8, type = "upper")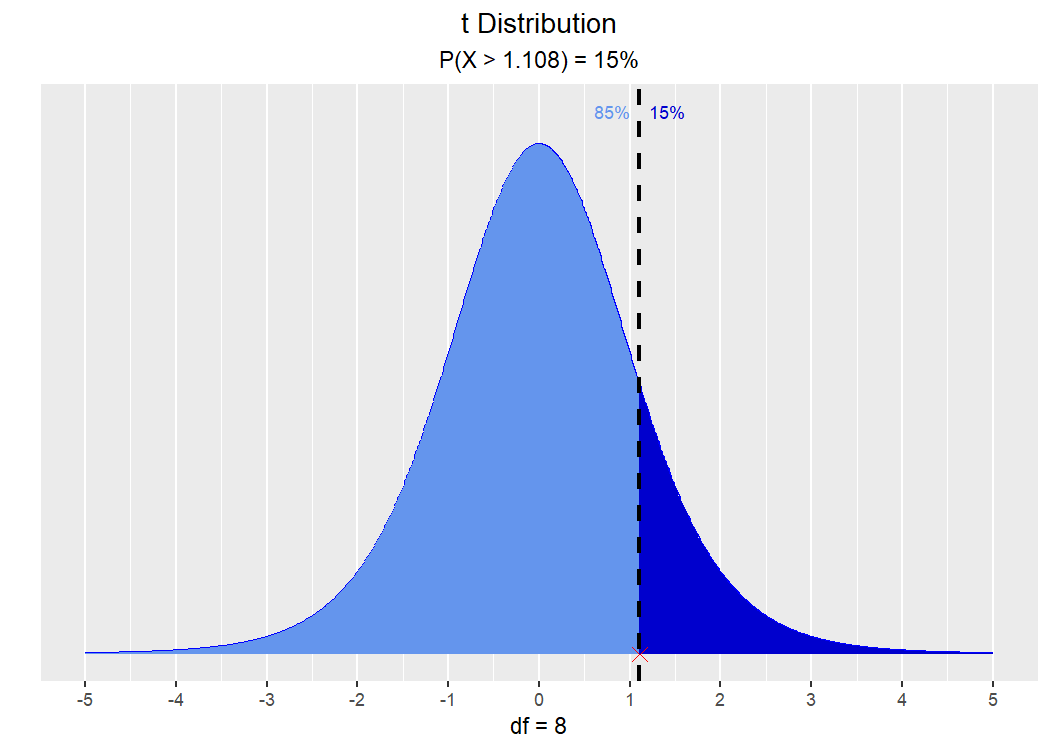
# probability between -2 and 2
vdist_t_prob(2, df = 6, type = "interval")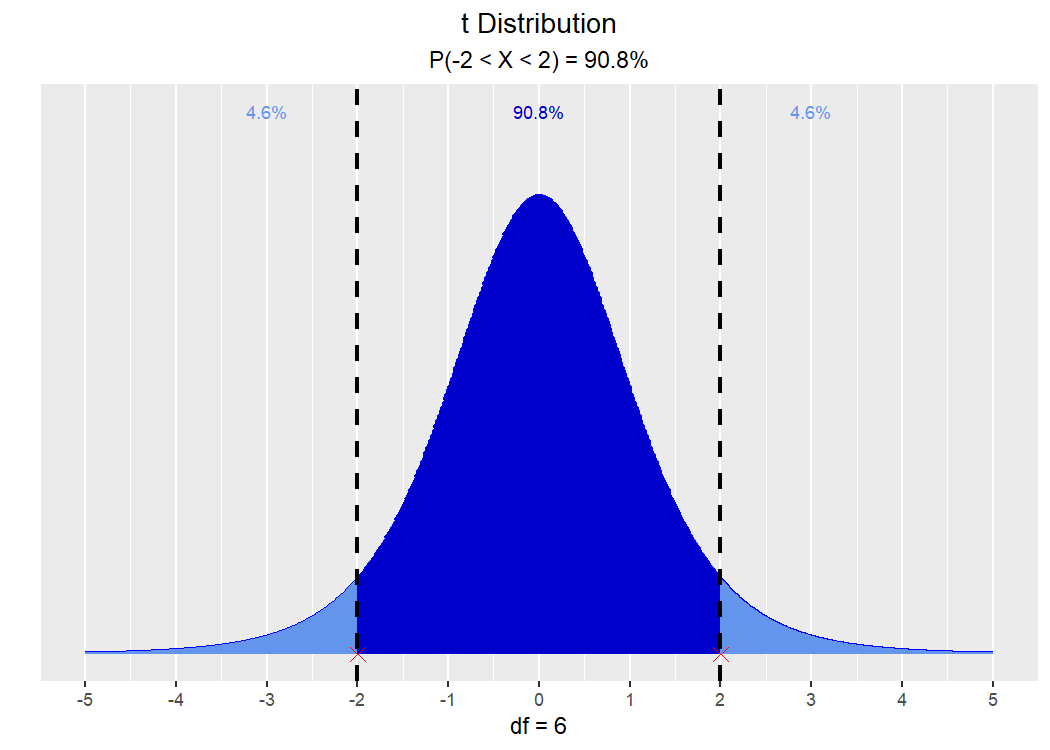
vdist_chisquare_plot(df = 5)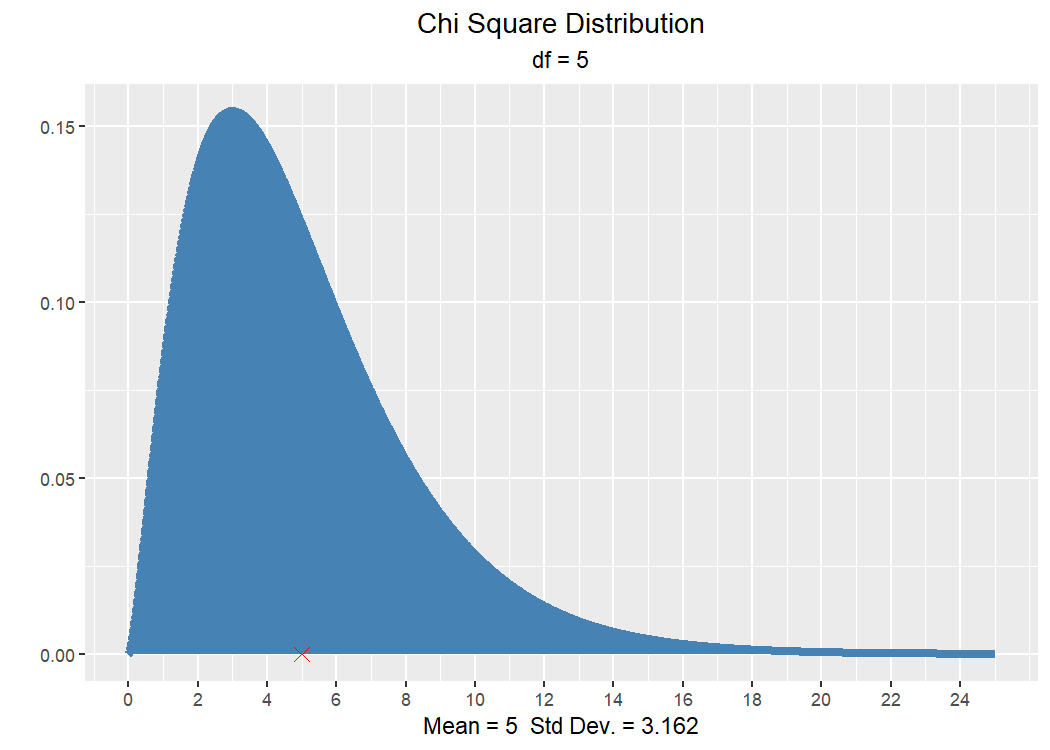
# tenth percentile
vdist_chisquare_perc(0.10, df = 8, type = "lower")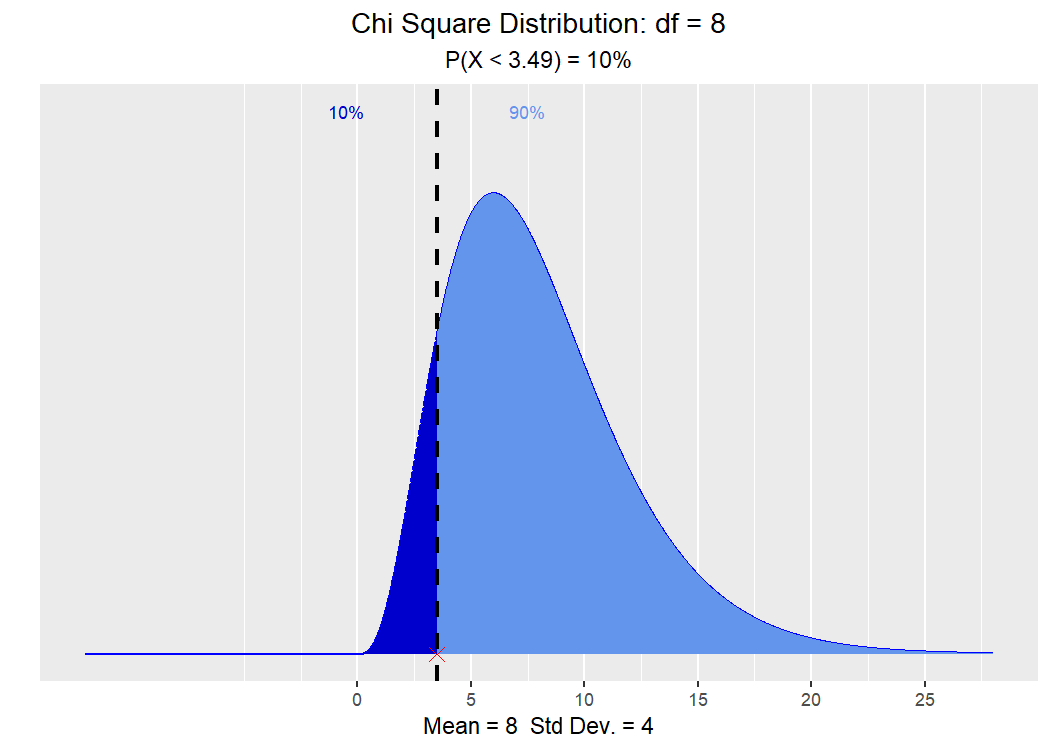
# P(X > 8.79) with 12 df
vdist_chisquare_prob(8.79, df = 12, type = "upper")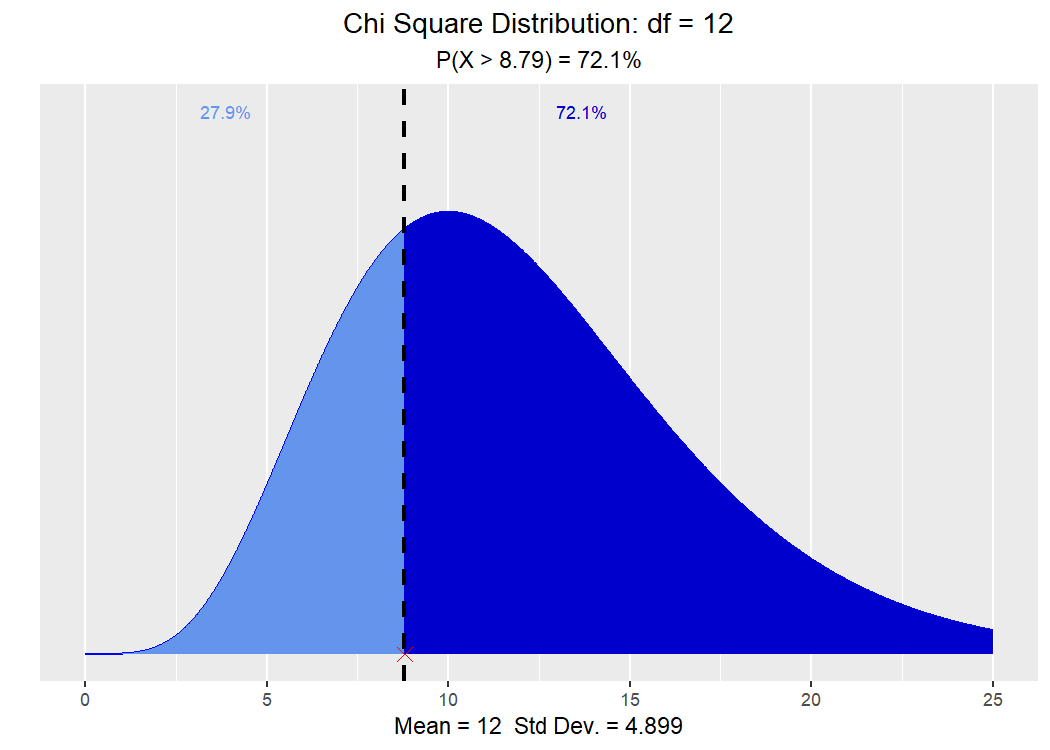
vdist_f_plot()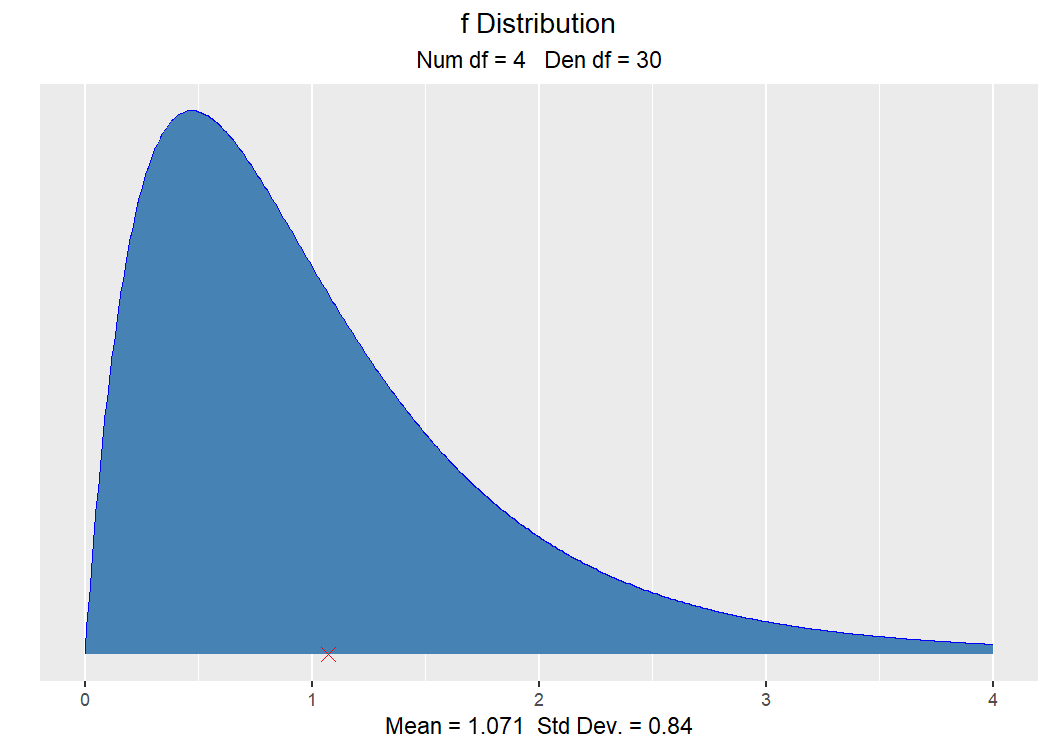
# upper twentieth percentile, F(4, 5)
vdist_f_perc(0.20, num_df = 4, den_df = 5, type = "upper")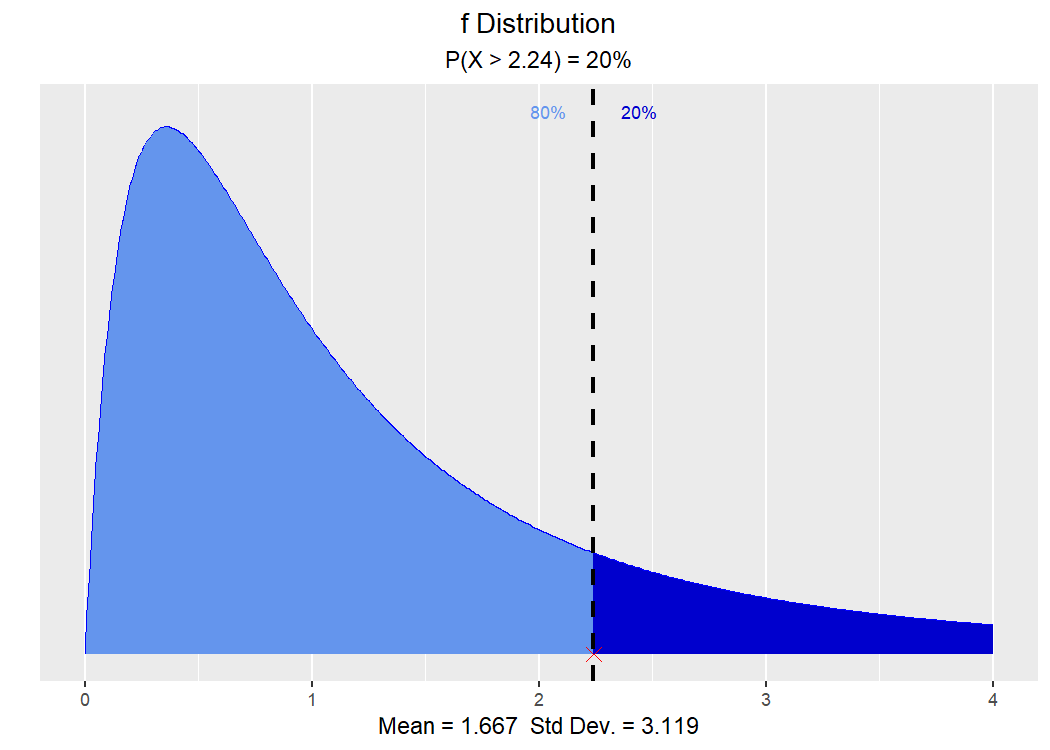
# P(X > 3.89), F(4, 5)
vdist_f_prob(3.89, num_df = 4, den_df = 5, type = "upper")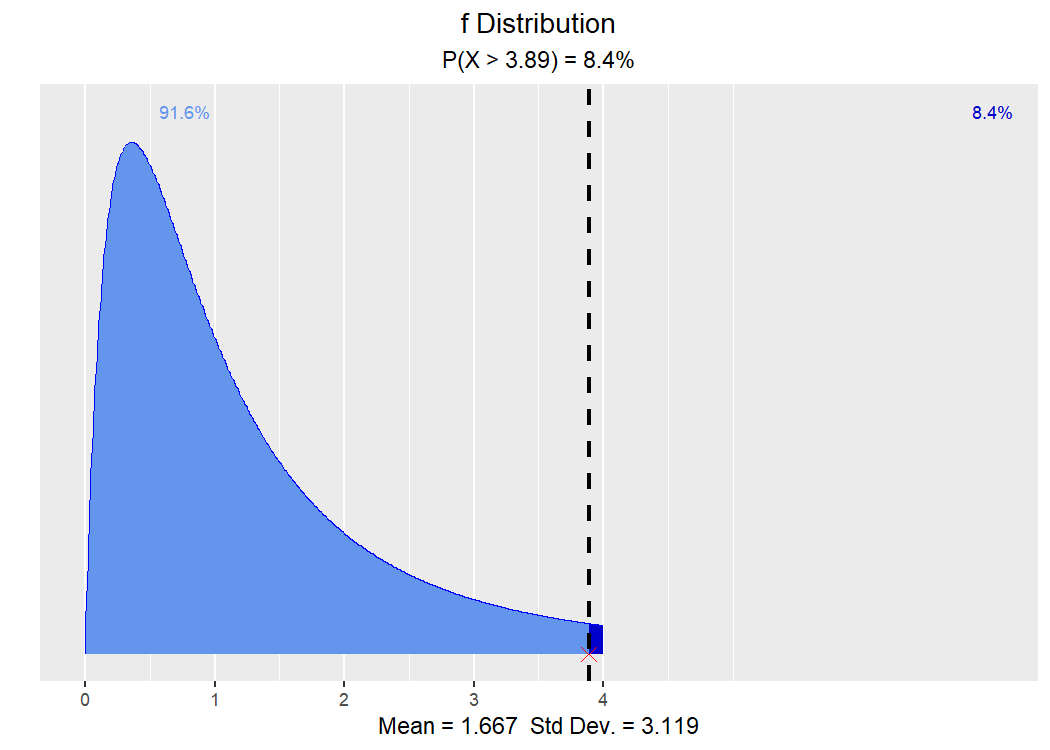
vdist_binom_plot(12, 0.2)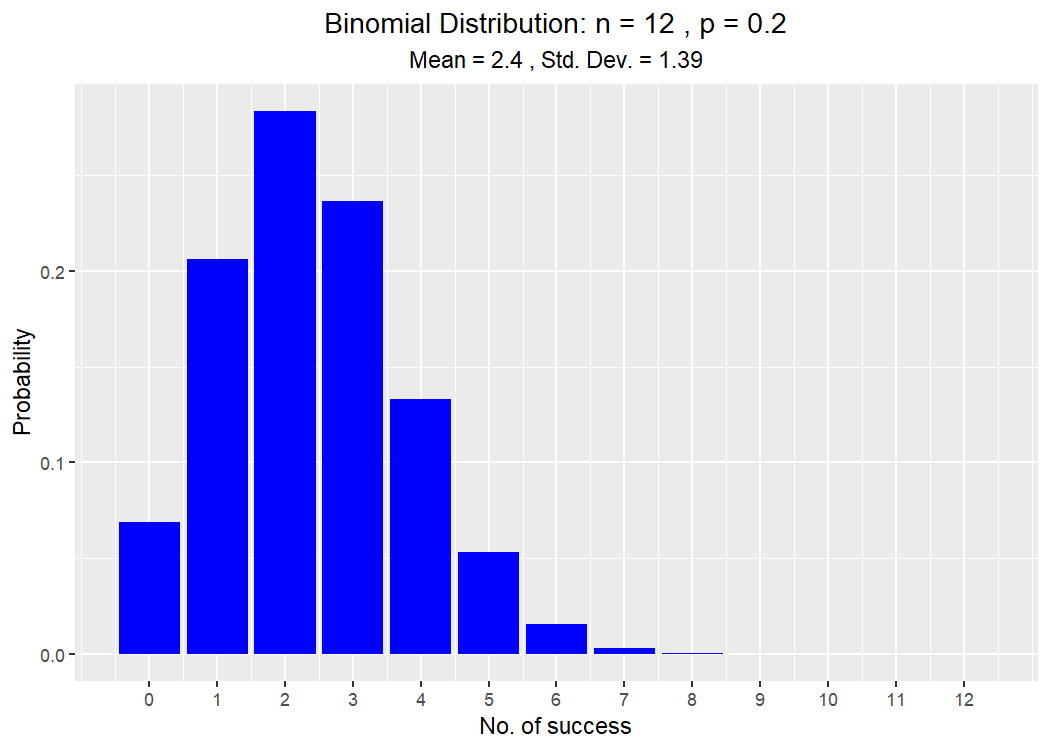
# exactly 4 successes out of 12
vdist_binom_prob(12, 0.2, 4, type = "exact")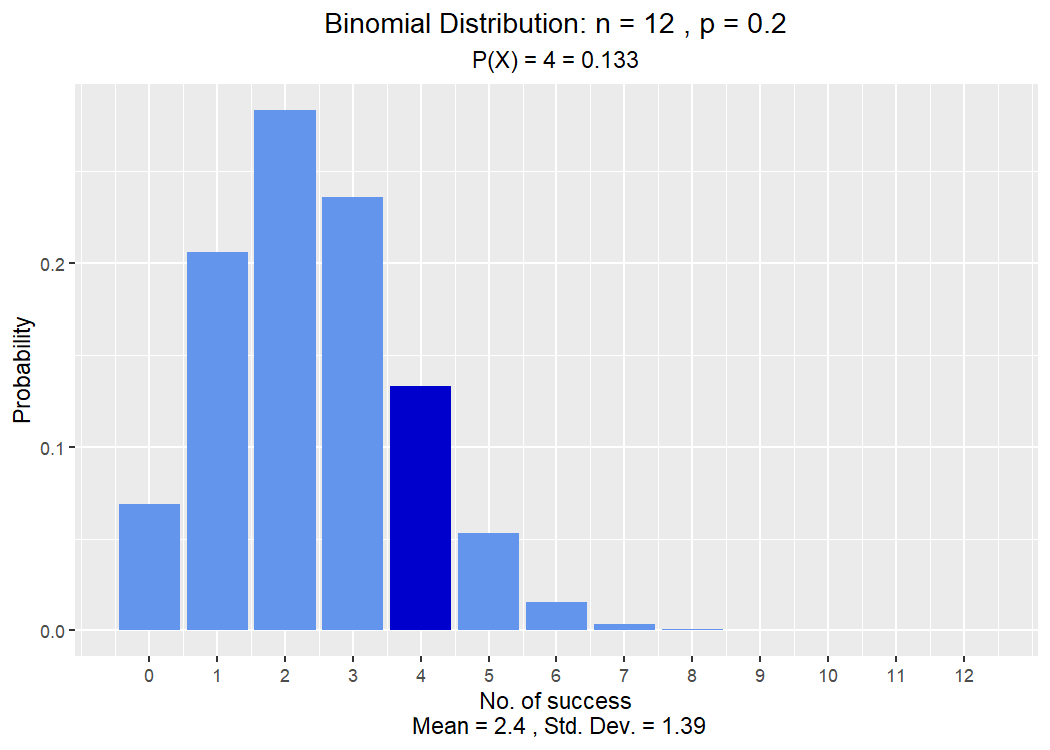
# at most 1 success
vdist_binom_prob(12, 0.2, 1, type = "lower")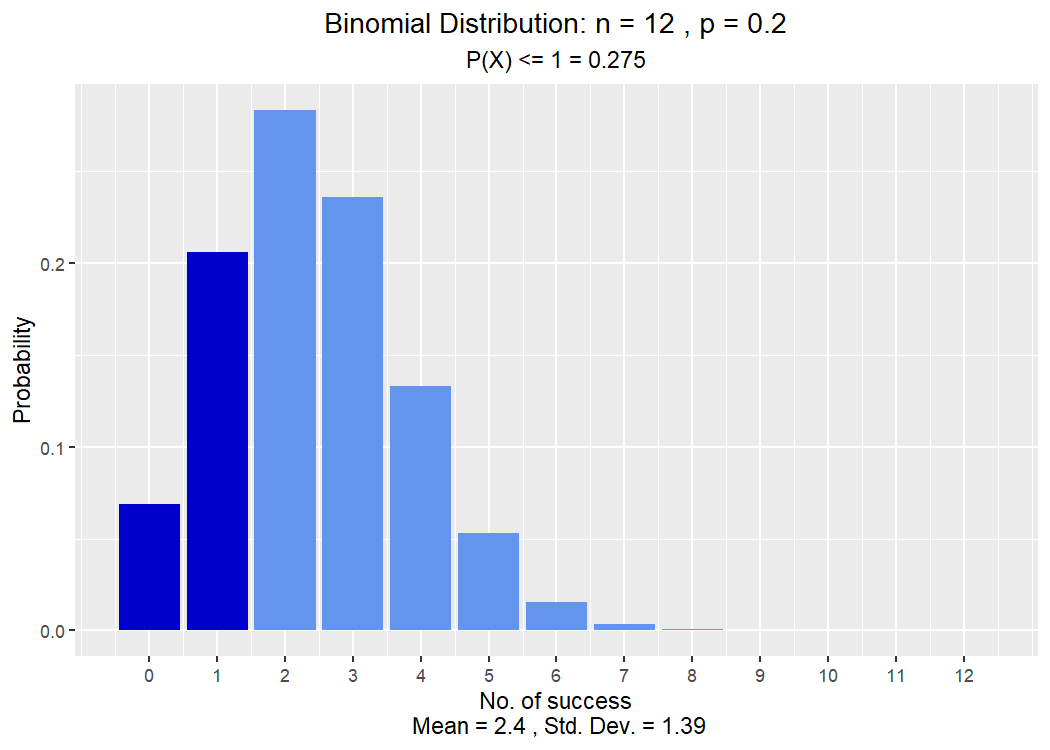
library(ggplot2)

p <- vdist_normal_plot(mean = 60, sd = 3, print_plot = FALSE)
p + theme_minimal() + labs(title = "Normal(60, 3)")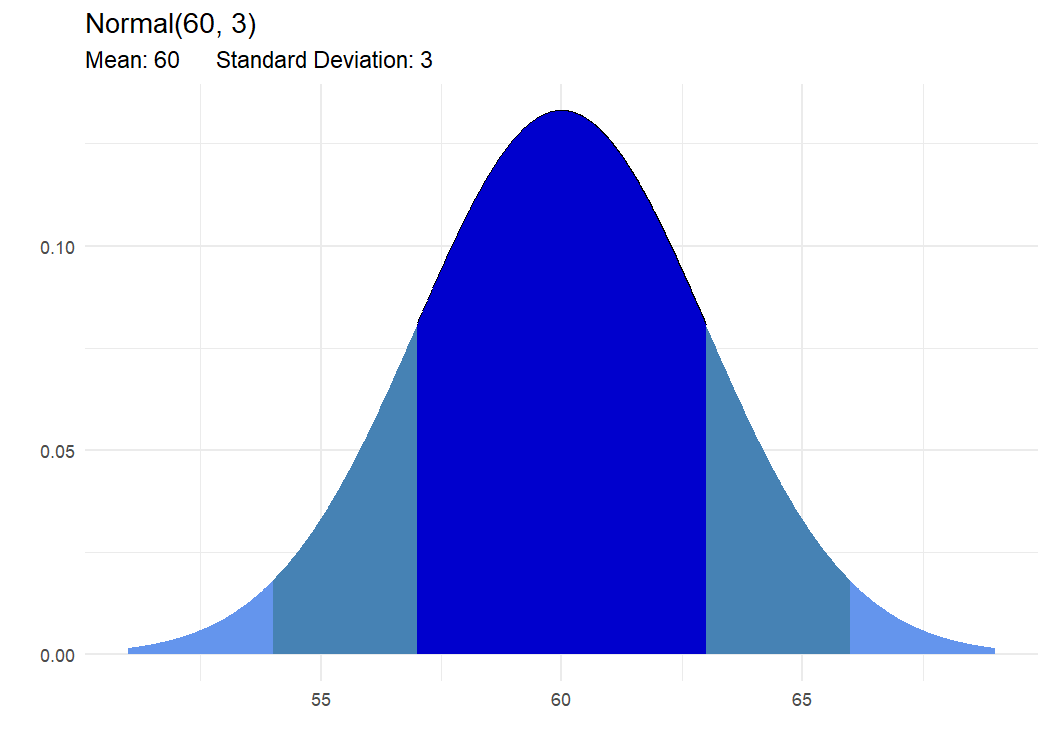
vistributions
focuses on five teaching families with annotated ggplot2
output.xpnorm() and friends) is course-framework bound;
vistributions works standalone.vistributions is the lightweight
classroom companion. Native distributional dispatch is
planned for v1.0 (see roadmap/).If you encounter a bug, please file a minimal reproducible example
using reprex on GitHub.
For questions and clarifications, please use Stack Overflow (tagged
vistributions or r).
These binaries (installable software) and packages are in development.
They may not be fully stable and should be used with caution. We make no claims about them.