The hardware and bandwidth for this mirror is donated by METANET, the Webhosting and Full Service-Cloud Provider.
If you wish to report a bug, or if you are interested in having us mirror your free-software or open-source project, please feel free to contact us at mirror[@]metanet.ch.
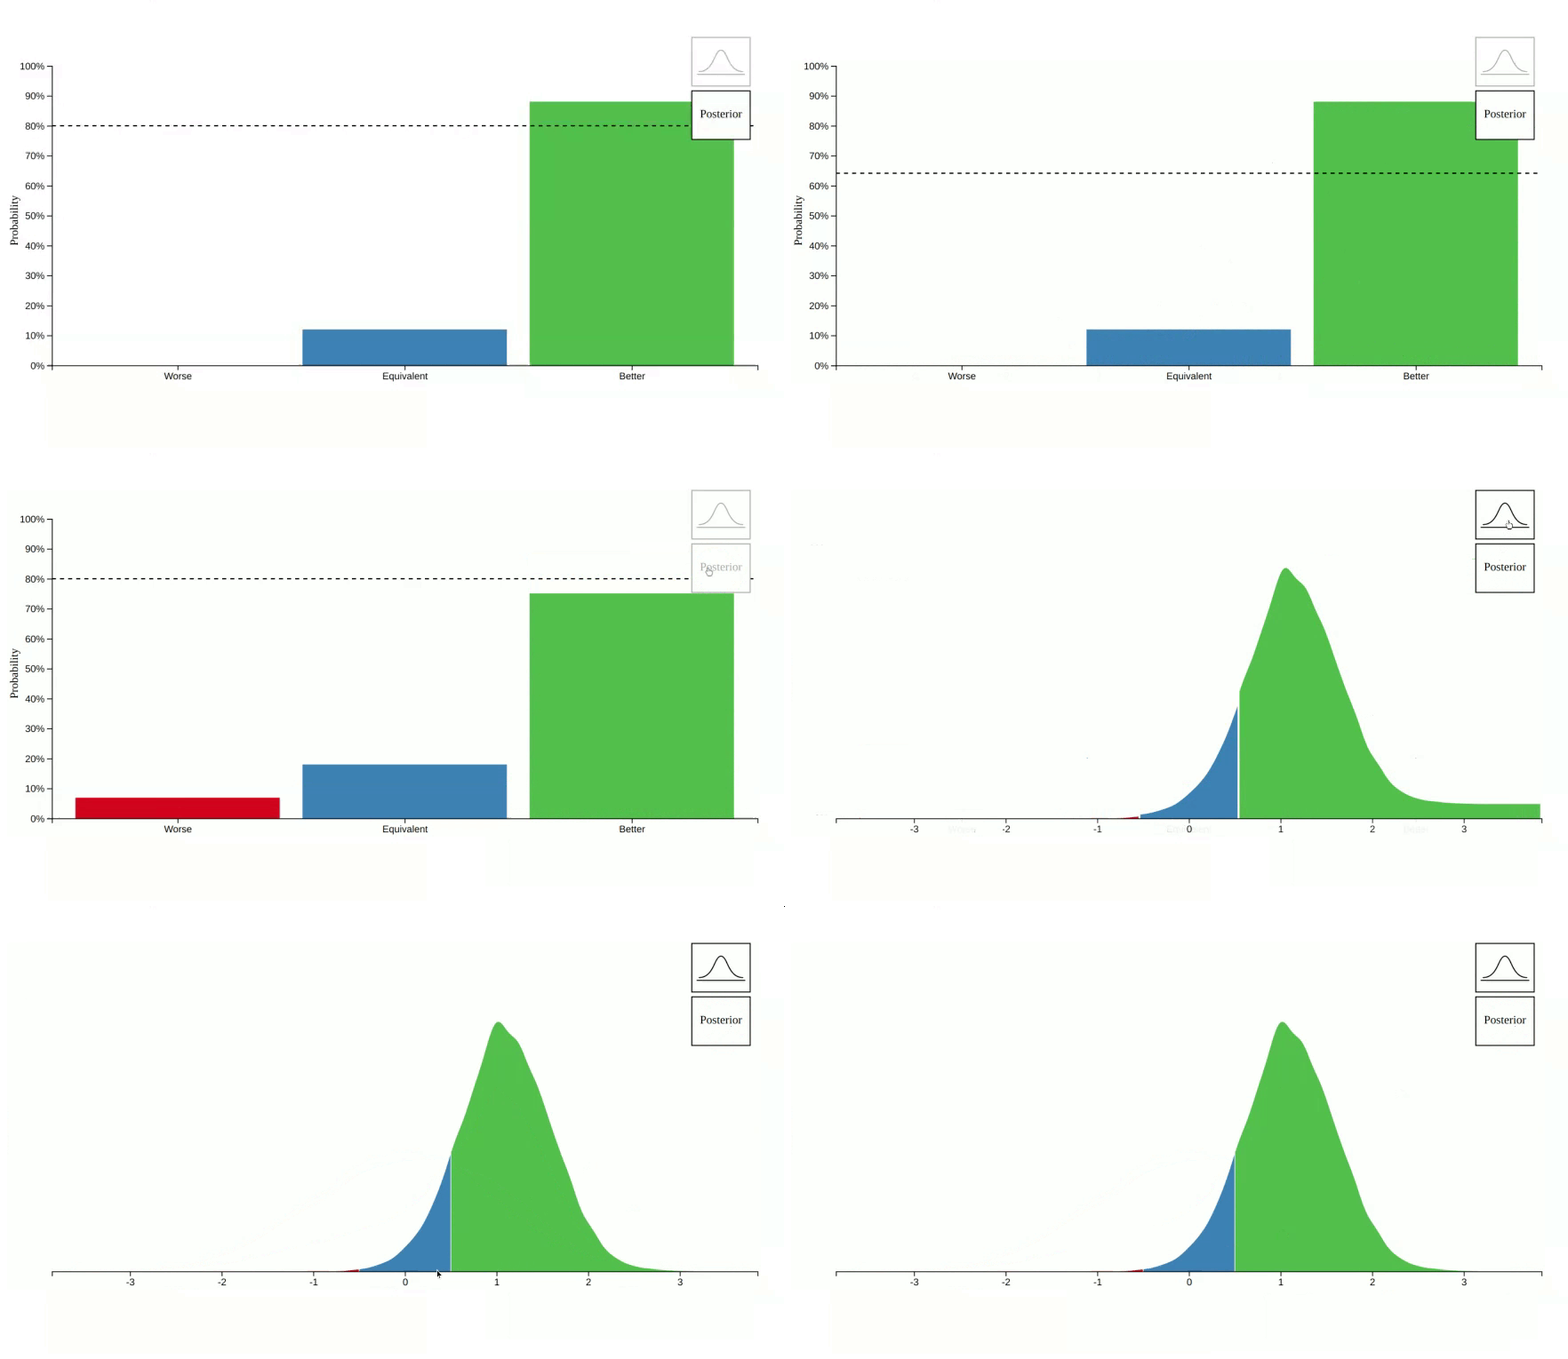
vizdraws creates interactive visualizations using draws from a prior and posterior distributions.
install.packages('vizdraws')The latest development version can be installed from github:
# install.packages("remotes")
remotes::install_github('ignacio82/vizdraws')This is a example which shows you how to how to visualize the transition from the prior to the posterior:
library(vizdraws)
set.seed(9782)
vizdraws(prior = rnorm(10000, 0, 1), posterior = rnorm(10000, 1.1, 0.5), MME = 0.5, threshold = 0.8)
The bell-curve icon was created by Davo Sime.
These binaries (installable software) and packages are in development.
They may not be fully stable and should be used with caution. We make no claims about them.