The hardware and bandwidth for this mirror is donated by METANET, the Webhosting and Full Service-Cloud Provider.
If you wish to report a bug, or if you are interested in having us mirror your free-software or open-source project, please feel free to contact us at mirror[@]metanet.ch.
The goal of vmeasur is to quantify the contractile nature of vessels monitored under an operating microscope.
You can install the released version of vmeasur from CRAN with:
install.packages("vmeasur")And the development version from GitHub with:
# install.packages("devtools")
devtools::install_github("JamesHucklesby/vmeasur")To calibrate an operating microscope, take an image of a gradiated ruler. You can then use this function to calculate the number of pixels per mm.
calibrate_pixel_size()Once video data is collected, the region of interest can be selected using select_roi. This provides a wizard that will assist the user through image analysis.
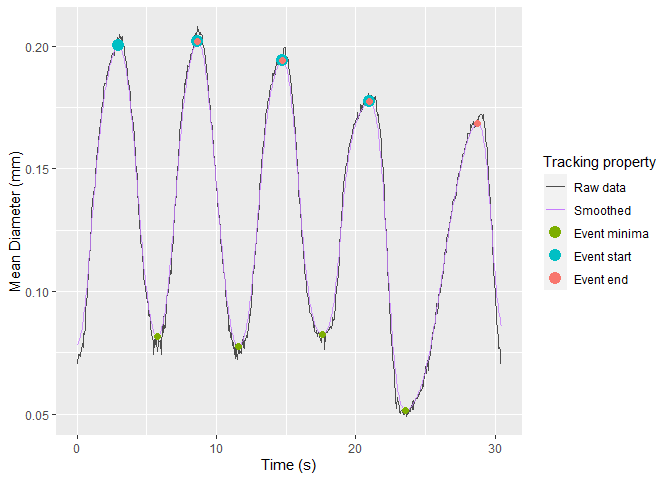
select_roi()Once selected, vmeasur can output a variety of important parameters and graphs

#> # A tibble: 4 x 12
#> # Rowwise:
#>   event_maxima event_start event_end type     start_value end_value max_value
#>          <dbl>       <dbl>     <dbl> <chr>          <dbl>     <dbl>     <dbl>
#> 1          531         472       647 contract        12.9      12.3      3.76
#> 2          261         195       331 contract        14.7      14.2      5.67
#> 3          130          67       195 contract        14.6      14.7      5.95
#> 4          396         331       472 contract        14.2      12.9      6.02
#> # ... with 5 more variables: baseline_change <dbl>, event_duration <dbl>,
#> #   cont_duration <dbl>, fill_duration <dbl>, event_gradient <dbl>
#> # A tibble: 6 x 4
#>   variable   mean      sd overall
#>   <chr>     <dbl>   <dbl> <chr>
#> 1 CA       0.12   0.00645 0.12 (0.006448)
#> 2 CD       2.77   0.136   2.774 (0.1358)
#> 3 CS       0.0434 0.00390 0.04337 (0.003905)
#> 4 ED       6.36   0.908   6.36 (0.9081)
#> 5 EDD      0.193  0.0112  0.1932 (0.0112)
#> 6 EDD2     0.185  0.0152  0.1854 (0.01517)
#>   X.1 y p_width excluded filename
#> 1   1 1       0    FALSE        1
#> 2   2 2       0    FALSE        1
#> 3   3 3       0    FALSE        1
#> 4   4 4       0    FALSE        1
#> 5   5 5       0    FALSE        1
#> 6   6 6       0    FALSE        1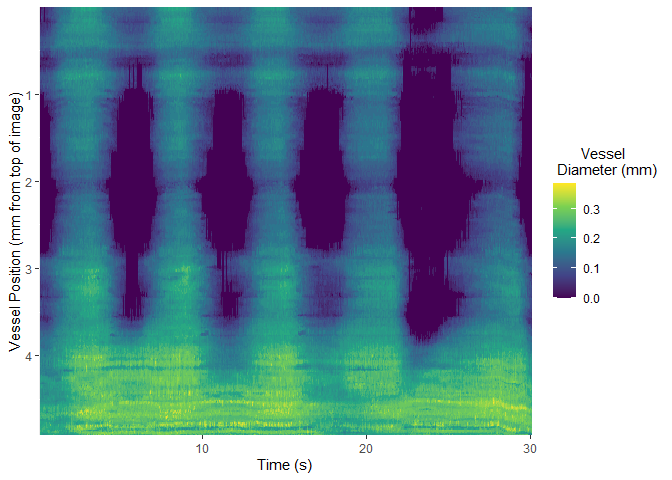
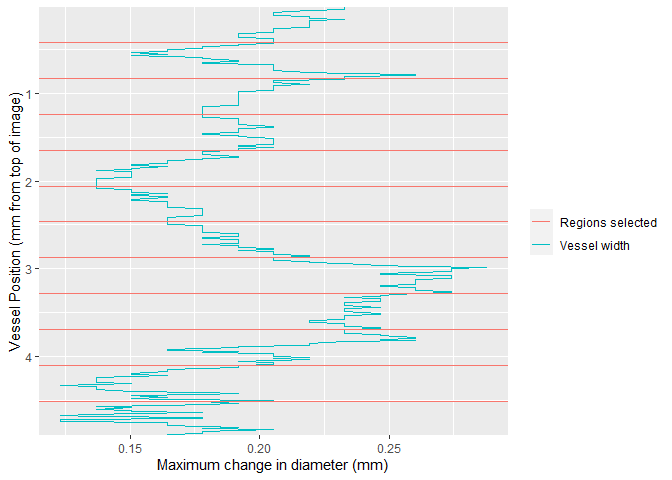
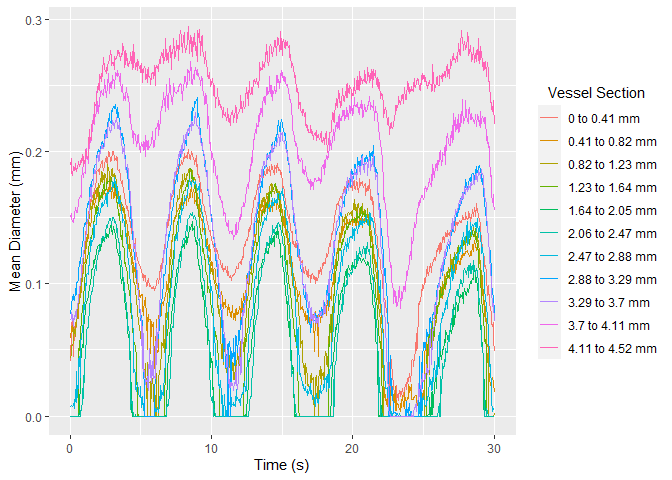
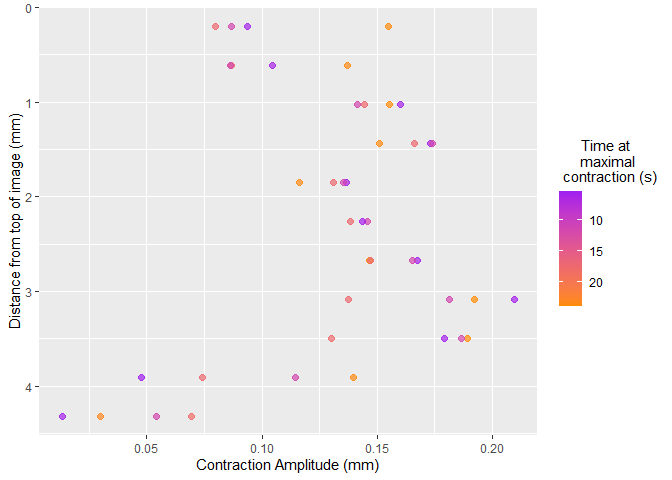
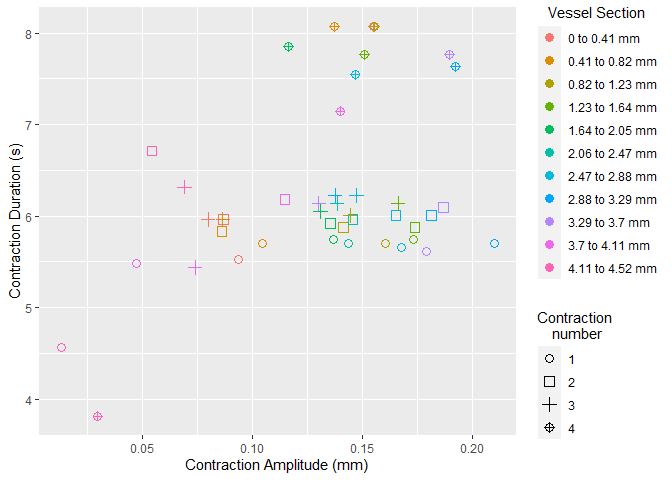
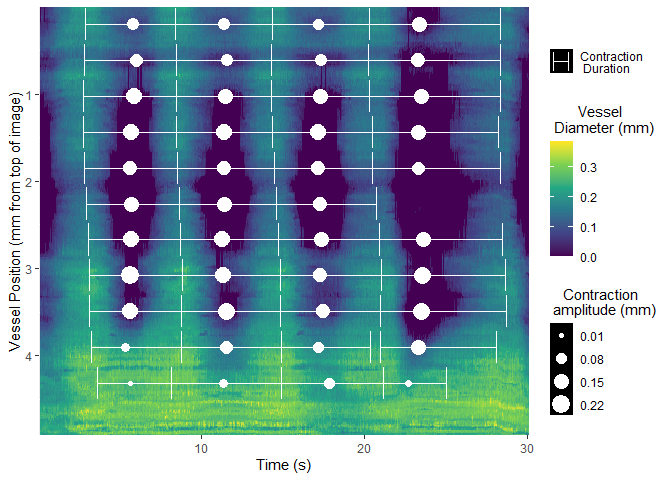
#> # A tibble: 6 x 15
#> # Groups:   source_file [6]
#>   ygroup event_maxima event_start event_end type     start_value end_value
#>   <chr>         <dbl>       <dbl>     <dbl> <chr>          <dbl>     <dbl>
#> 1 3               134          62       192 contract       13.2      13.2
#> 2 4               130          62       193 contract       12.6      12.7
#> 3 2               136          63       193 contract       12.3      12.1
#> 4 5               128          63       194 contract        9.97      9.88
#> 5 1               132          65       191 contract       14.2      14.2
#> 6 6               129          66       196 contract       10.5      10.6
#> # ... with 8 more variables: max_value <dbl>, baseline_change <dbl>,
#> #   event_duration <dbl>, cont_duration <dbl>, fill_duration <dbl>,
#> #   event_gradient <dbl>, source_file <dbl>, cont_id <int>
#> # A tibble: 6 x 5
#>   ygroup variable   mean      sd overall
#>   <chr>  <chr>     <dbl>   <dbl> <chr>
#> 1 1      CA       0.104  0.0345  0.1038 (0.03449)
#> 2 1      CD       2.96   0.0913  2.961 (0.0913)
#> 3 1      CS       0.0349 0.0105  0.03486 (0.01051)
#> 4 1      ED       6.38   1.14    6.382 (1.145)
#> 5 1      EDD      0.188  0.00948 0.1875 (0.009478)
#> 6 1      EDD2     0.177  0.0190  0.1768 (0.01904)
These binaries (installable software) and packages are in development.
They may not be fully stable and should be used with caution. We make no claims about them.